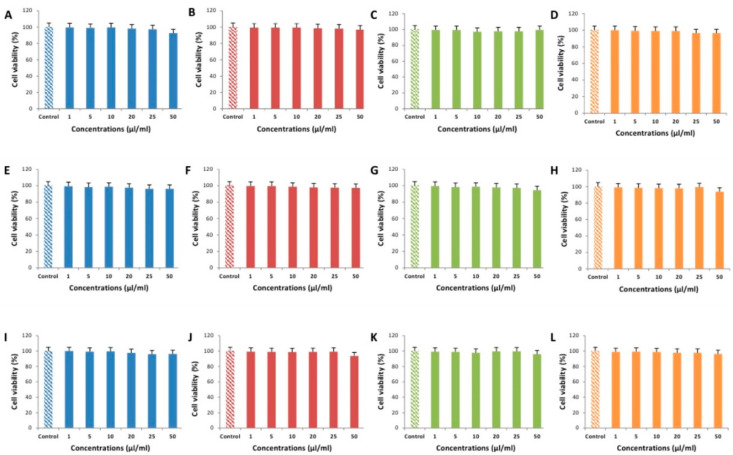
Figure 2.
Effect observed in MARC-145 (A–D), PK-15 (E–H), and Vero (I–L) cell lines, caused by oregano extract (carvacrol) (A,E,I; colored blue), mint essential oil (menthol) (B,F,J; colored red), thyme essential oil (C,G,K; colored green), and a mixture of all tested compounds (D,H,L; colored orange) in concentrations of 1, 5, 10, 20, 25, and 50 µl/mL concentrations. Each bar represents mean ± SD of triplicate sample data. Concentration multigroup comparisons were performed using Kruskal-Wallis test.

