Figure 2.
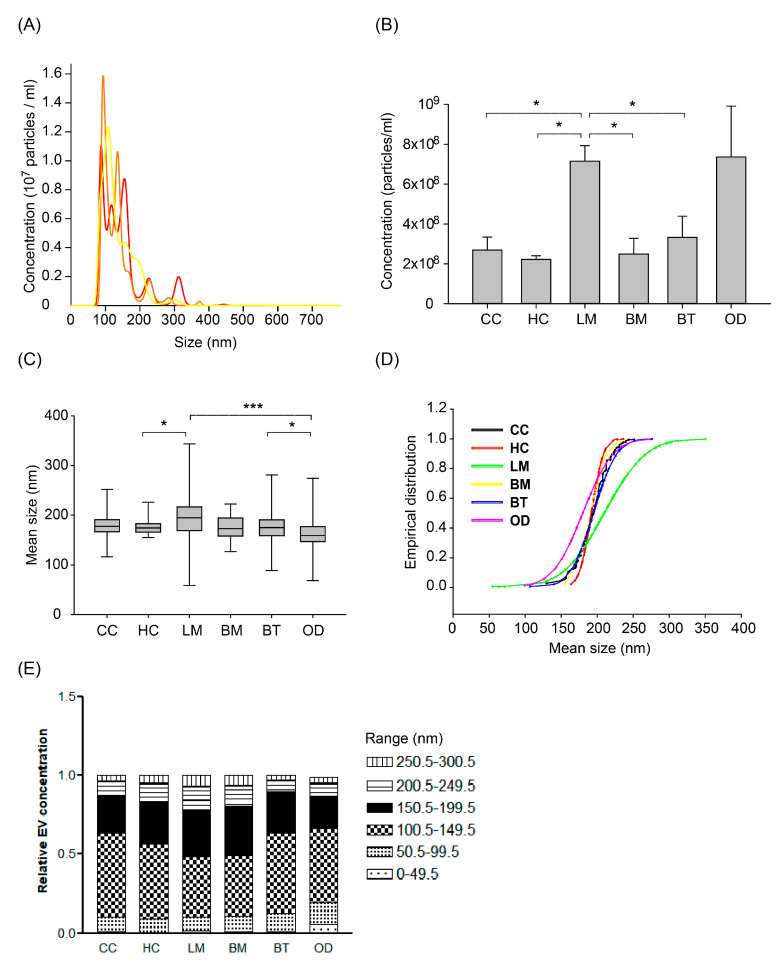
The number of extracellular vesicles (EVs) measured by Nanoparticle Tracking Analysis using the Nanosight NS300 system according to patients groups. (A) Representative image of NTA measurement (repeated 3 times per one sample and an average value was provided). (B) Extracellular vesicle (EV) concentration according to patient groups. Different EV concentrations among groups of ‘Other disease’ according to different disease of multiple sclerosis, intracranial hemorrhage, and central nervous system (CNS) infection (see details in Supplementary Figure S5) (ANOVA, Dunn’s multiple comparison, * p < 0.05). (C) Box plot of size distribution of EVs according to patient groups. The thick bar represents the mean value, and the box denotes the quartile range. (ANOVA, Dunn’s multiple comparison, * p < 0.05, *** p < 0.001) (D) Empirical cumulative distribution plot of mean size of extracellular vesicles. (The empirical cumulative distribution function (ECDF) was generated by the Ecdf function in R, Kolmogorov-Smirnov tests were performed to compare the significance between groups) (E) The proportion of EV size by tentative size interval of 50 nm (0–300 nm). Abbreviations: CC, cancer control; HC, healthy control; LM, leptomeningeal metastasis; BM, brain metastasis; BT, brain tumor.

