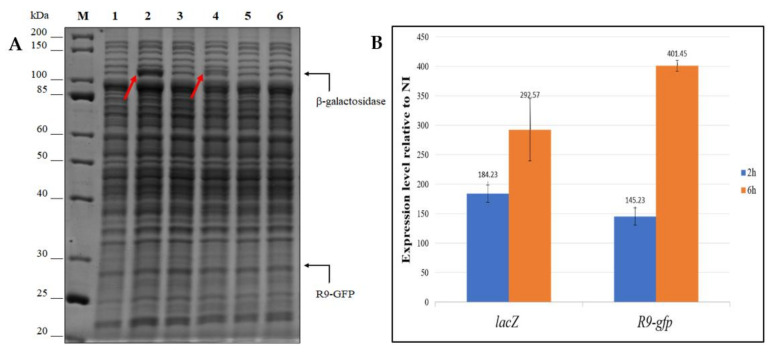
Figure 4.
β-galactosidase and R9-GFP proteins productions (panel A) and their respective mRNA transcriptions (panel B). (A) SDS-PAGE analysis of cell extracts of KrPL strains producing the β-galactosidase (lanes 1–4) and R9-GFP (lanes 5–6). The induction was performed with 10 mM D-galactose for pMAV carrying strains and with 1 mM IPTG for pP79 bearing cells and protracted for 26 h. M, molecular weight marker; 1, non-induced pP79-lacZ; 2, induced pP79-lacZ; 3, non-induced pMAV-lacZ; 4, induced pMAV-lacZ; 5, induced pP79-R9-gfp; 6, induced pMAV-R9-gfp. Black arrows on the right of the gel represent the expected molecular weights of the recombinant proteins. Red arrows inside the gel highlight the bands of the β-galactosidase. (B) Relative quantification by RT-qPCR of mRNA expression levels of lacZ and R9-gfp. Two genes under the control of the PlacZ promoter were analyzed for their mRNA expression levels after 2 and 6 h from the induction in comparison to the non-induced condition. The reported results are the mean of three independent experiments.

