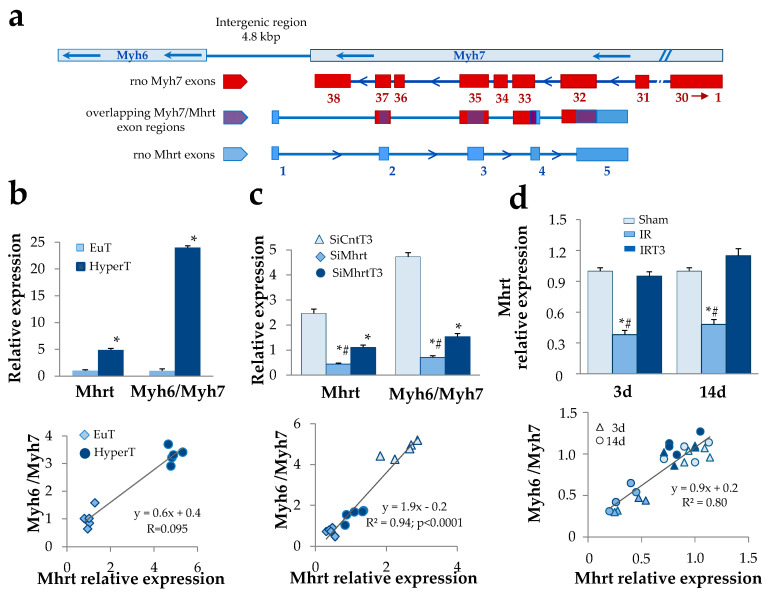
Figure 1.
Thyroid hormone-dependent regulation of Mhrt greatly affects Myh6/Myh7 expression ratio. (a) Schematic illustration of the rat Mhrt, Myh6, and Myh7 gene organization. Red boxes represent Myh7 exons; blue boxes represent Mhrt exons; the overlapping Myh/Mhrt exon regions are depicted in violet. (b) Quantification of cardiac Mhrt expression and correlation with Myh6/Myh7 expression ratio in euthyroid rats (EuT) and in hyperthyroid rats (HyperT). (n = 5; * p < 0.0001 HyperT vs. EuT). (c) Quantification of Mhrt expression and correlation with Myh6/Myh7 expression ratio in cultured rat neonatal cardiomyocytes (NRCM). Twenty-four hours after transfection with SiRNA specific for Mhrt (SiMhrt) or control SiRNA (SiCnt), the NRCM were maintained for 48 h in the presence of T3 at physiological concentration (3 nM) or T3 vehicle. Light blue, triangle = SiCntT3; blue, rhombus = SiMhrt; dark blue, circle = SiMhrtT3 (n = 5 different cell batches; * p < 0.0001 vs. SiCnt, # p ≤ 0.01 vs. SiMhrtT3). (d) Quantification of Mhrt expression and correlation with Myh6/Myh7 expression ratio in an in vivo rat model of cardiac ischemia/reperfusion (IR). Twenty-four hours after IR, rats were subjected to 48 h infusion of T3 at replacement dose or to infusion of T3 vehicle for the same time. Mhrt and Myh6/Myh7 levels in the area at risk (AAR) of the left ventricle were quantified at 3 d and 14 d post IR. Color code: light blue = Sham; blue = IR; dark blue = IRT3; shape code: triangle = 3 d post IR; circle = 14 d post IR (n = 4 biological repeats for each experimental condition; * p < 0.0001 vs. Sham, # p < 0.0001 vs. IRT3).

