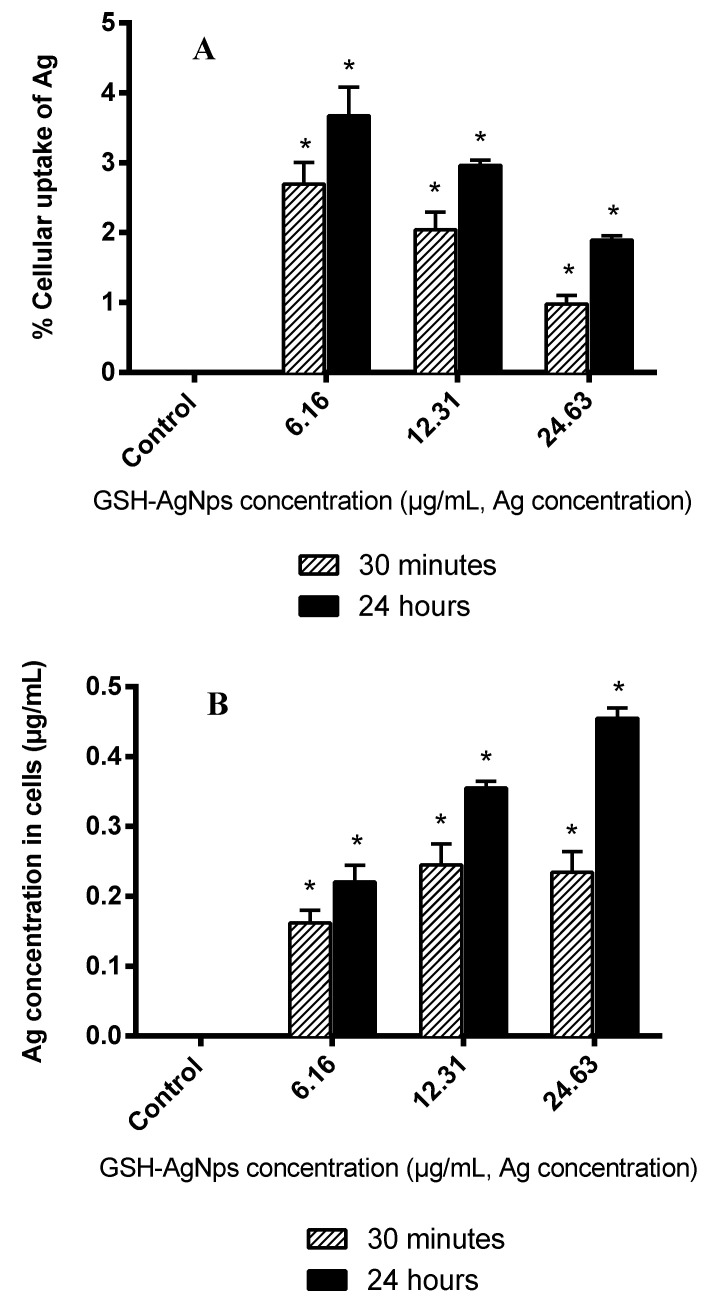
Figure 3.
Ag concentration in HGF-1 cells after exposure for 30 min and 24 h to GSH-AgNPs: (A) % cellular uptake of Ag (respect initial concentration) and (B) Ag concentration (μg/mL). The results are presented as mean ± standard deviation. * Significant differences respect to the control (p < 0.01).

