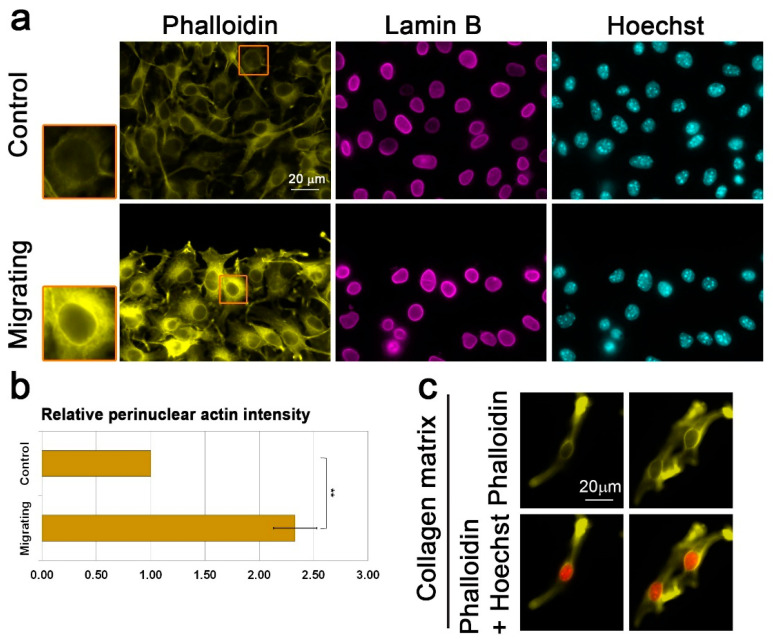
Figure 2.
Migration signals induce the formation of a perinuclear actin rim. (a) Perinuclear actin rim in B16–F10 migrating in the wound healing assay. Fluorescence microscope micrographs of confluent B16–F10 cells induced to migrate in the wound healing assay for 3 h stained for filamentous actin (Phalloidin) and DNA (Hoechst). Lamin B1 was immunostained. The edge of the scratch is in the top region of each micrograph. Scale bar: 20 μm. The nuclei in the orange rectangles are magnified on the left side. (b) Quantification of the actin perinuclear rim in B16–F10 migrating in the wound healing assay. The bar graph represents the change in intensity of perinuclear Phalloidin staining in migrating cells in comparison to control non-migrating cells. For quantification, in each experiment, 30–60 cells of each condition were measured, and the average mean intensity was calculated and normalized to control cells. The average mean intensity in three independent experiments ± s.e. is presented. Statistical significance was evaluated by the Student’s t-test, ** p < 0.01. (c) Collagen matrix induces accumulation of perinuclear actin filaments in B16–F10 cells. Fluorescence microscope micrographs of B16–F10 cells embedded inside collagen matrix for O.N. stained for filamentous actin (Phalloidin) and DNA (Hoechst). Two representative images are shown.

