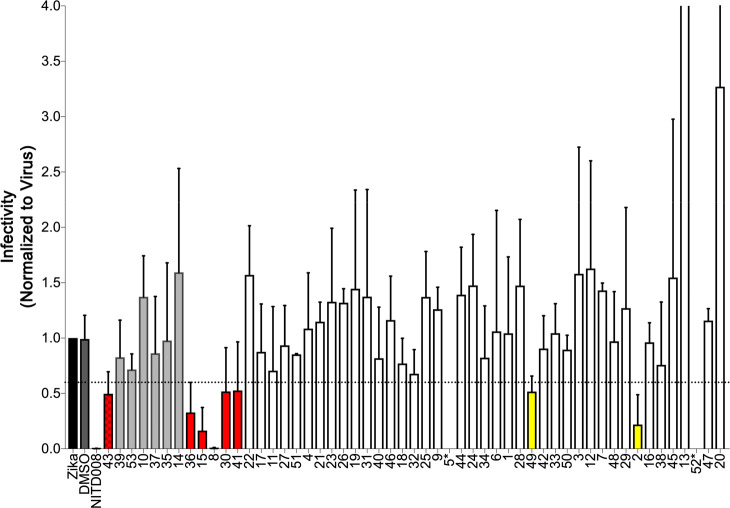
Figure 10.
TCID50 infectivity results for 53 candidate compounds compared to the positive control NITD008 (blue). Candidates 14 and 43 were tested at 10 μM; all of the other candidates and the NITD008 control were tested at 25 μM. Red bars represent candidates that inhibited infectivity to <0.6 (horizontal dotted line) in the TCID50 assay and >1.0 in the cell viability assay. Yellow bars represent candidates with TCID50 activity but not flagged as active in the cell viability assay. Candidates 5* and 52* did not yield results in the TCID50 assay.

