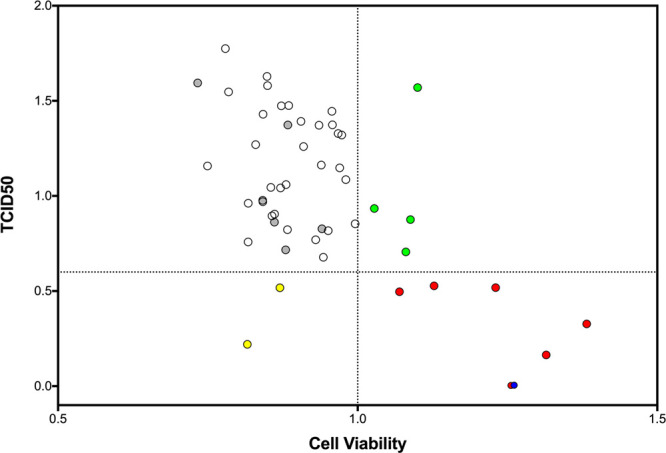
Figure 11.

X–Y scatter plot defining activity from cell viability (>1.0 cutoff) and TCID50 (<0.6 cutoff) assays. Compounds colored red (8, 15, 30, 36, 41, and 43) and blue (NITD008 control) were active in both assays. Compounds colored green (11, 17, 22, and 27) or yellow (2 and 49) were active in one assay.
