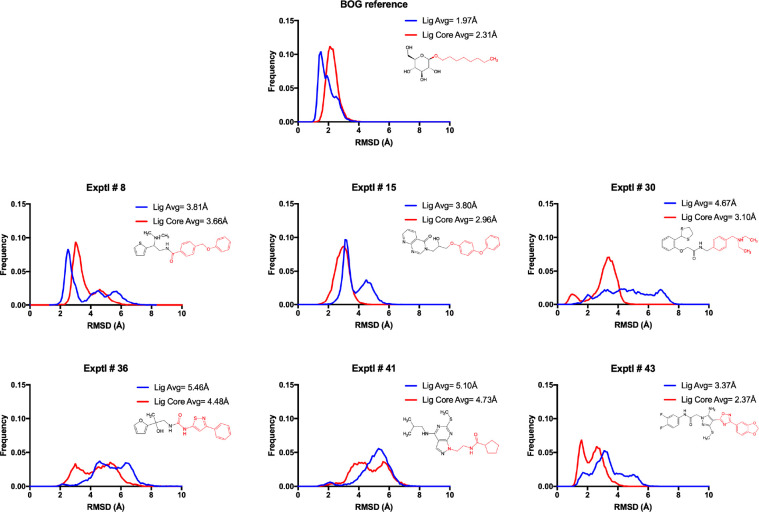
Figure 16.
RMSD histograms for BOG (to the initial modeled pose) and six hit compounds (to their initial DOCK poses) from four MD replicates each. The blue curve indicates the RMSD histogram for the full ligand. The red curve considers only the core of the compound. Ligand cores (red atoms in 2D depictions) identified by matching the closest heavy atom in the candidate ligand to the oxygen in the alkane tail of BOG. The analysis accounts for rotation in the region occupied by the polar headgroup of BOG, a phenomenon observed across several MD simulations.

