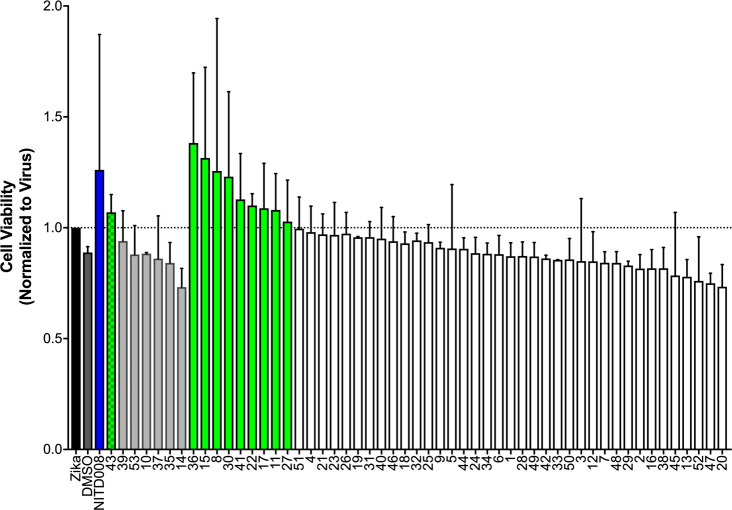
Figure 9.
Cell viability results for 53 candidate compounds compared to the positive control NITD008 (blue). The data were normalized to ZIKV-infected cells. Values over 1 signifies inhibition of ZIKV-induced cell killing. Candidates 14–43 tested at 10 μM, all other candidates and the control NITD008 tested at 25 μM. Each group ordered by activity from high to low. Green bars represent candidates with mean activity of >1.

