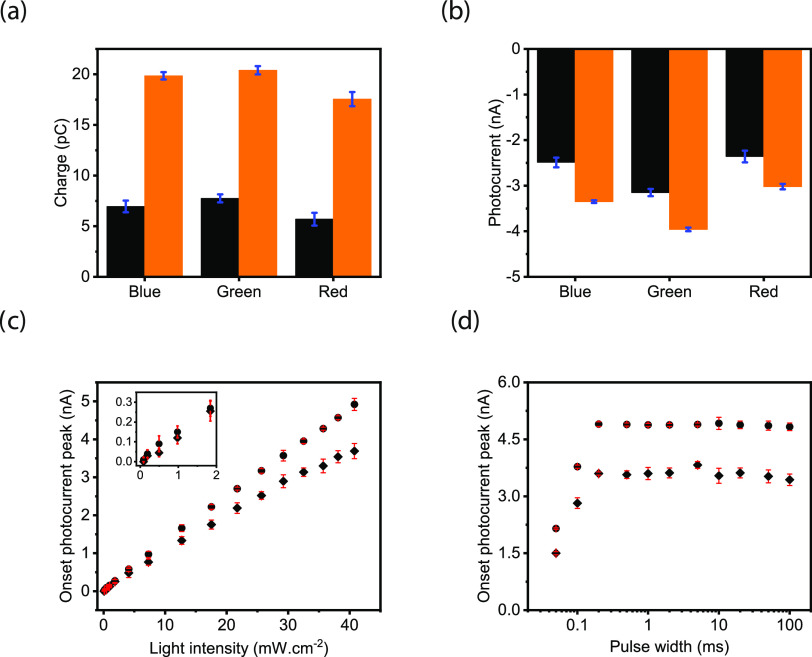
Figure 2.
(a) Injected amount of charges and (b) current peaks of the control (black) and plasmonic biointerfaces (orange) at 8.8 ± 0.2 × 10¹⁶ photons s–1·cm–2 with 10 ms pulse widths. (c) Magnitude of the peak of capacitive photocurrentcurrents of the control (rhombus dots) and plasmonic (circle dots) biointerfaces under different light intensity levels. (d) Magnitude of the peak capacitive currents generated by the control (rhombus dots) and plasmonic (circle dots) biointerfaces under different pulse widths having light intensity at 8.8 ± 0.2 × 10¹⁶ photons s–1·cm–2.

