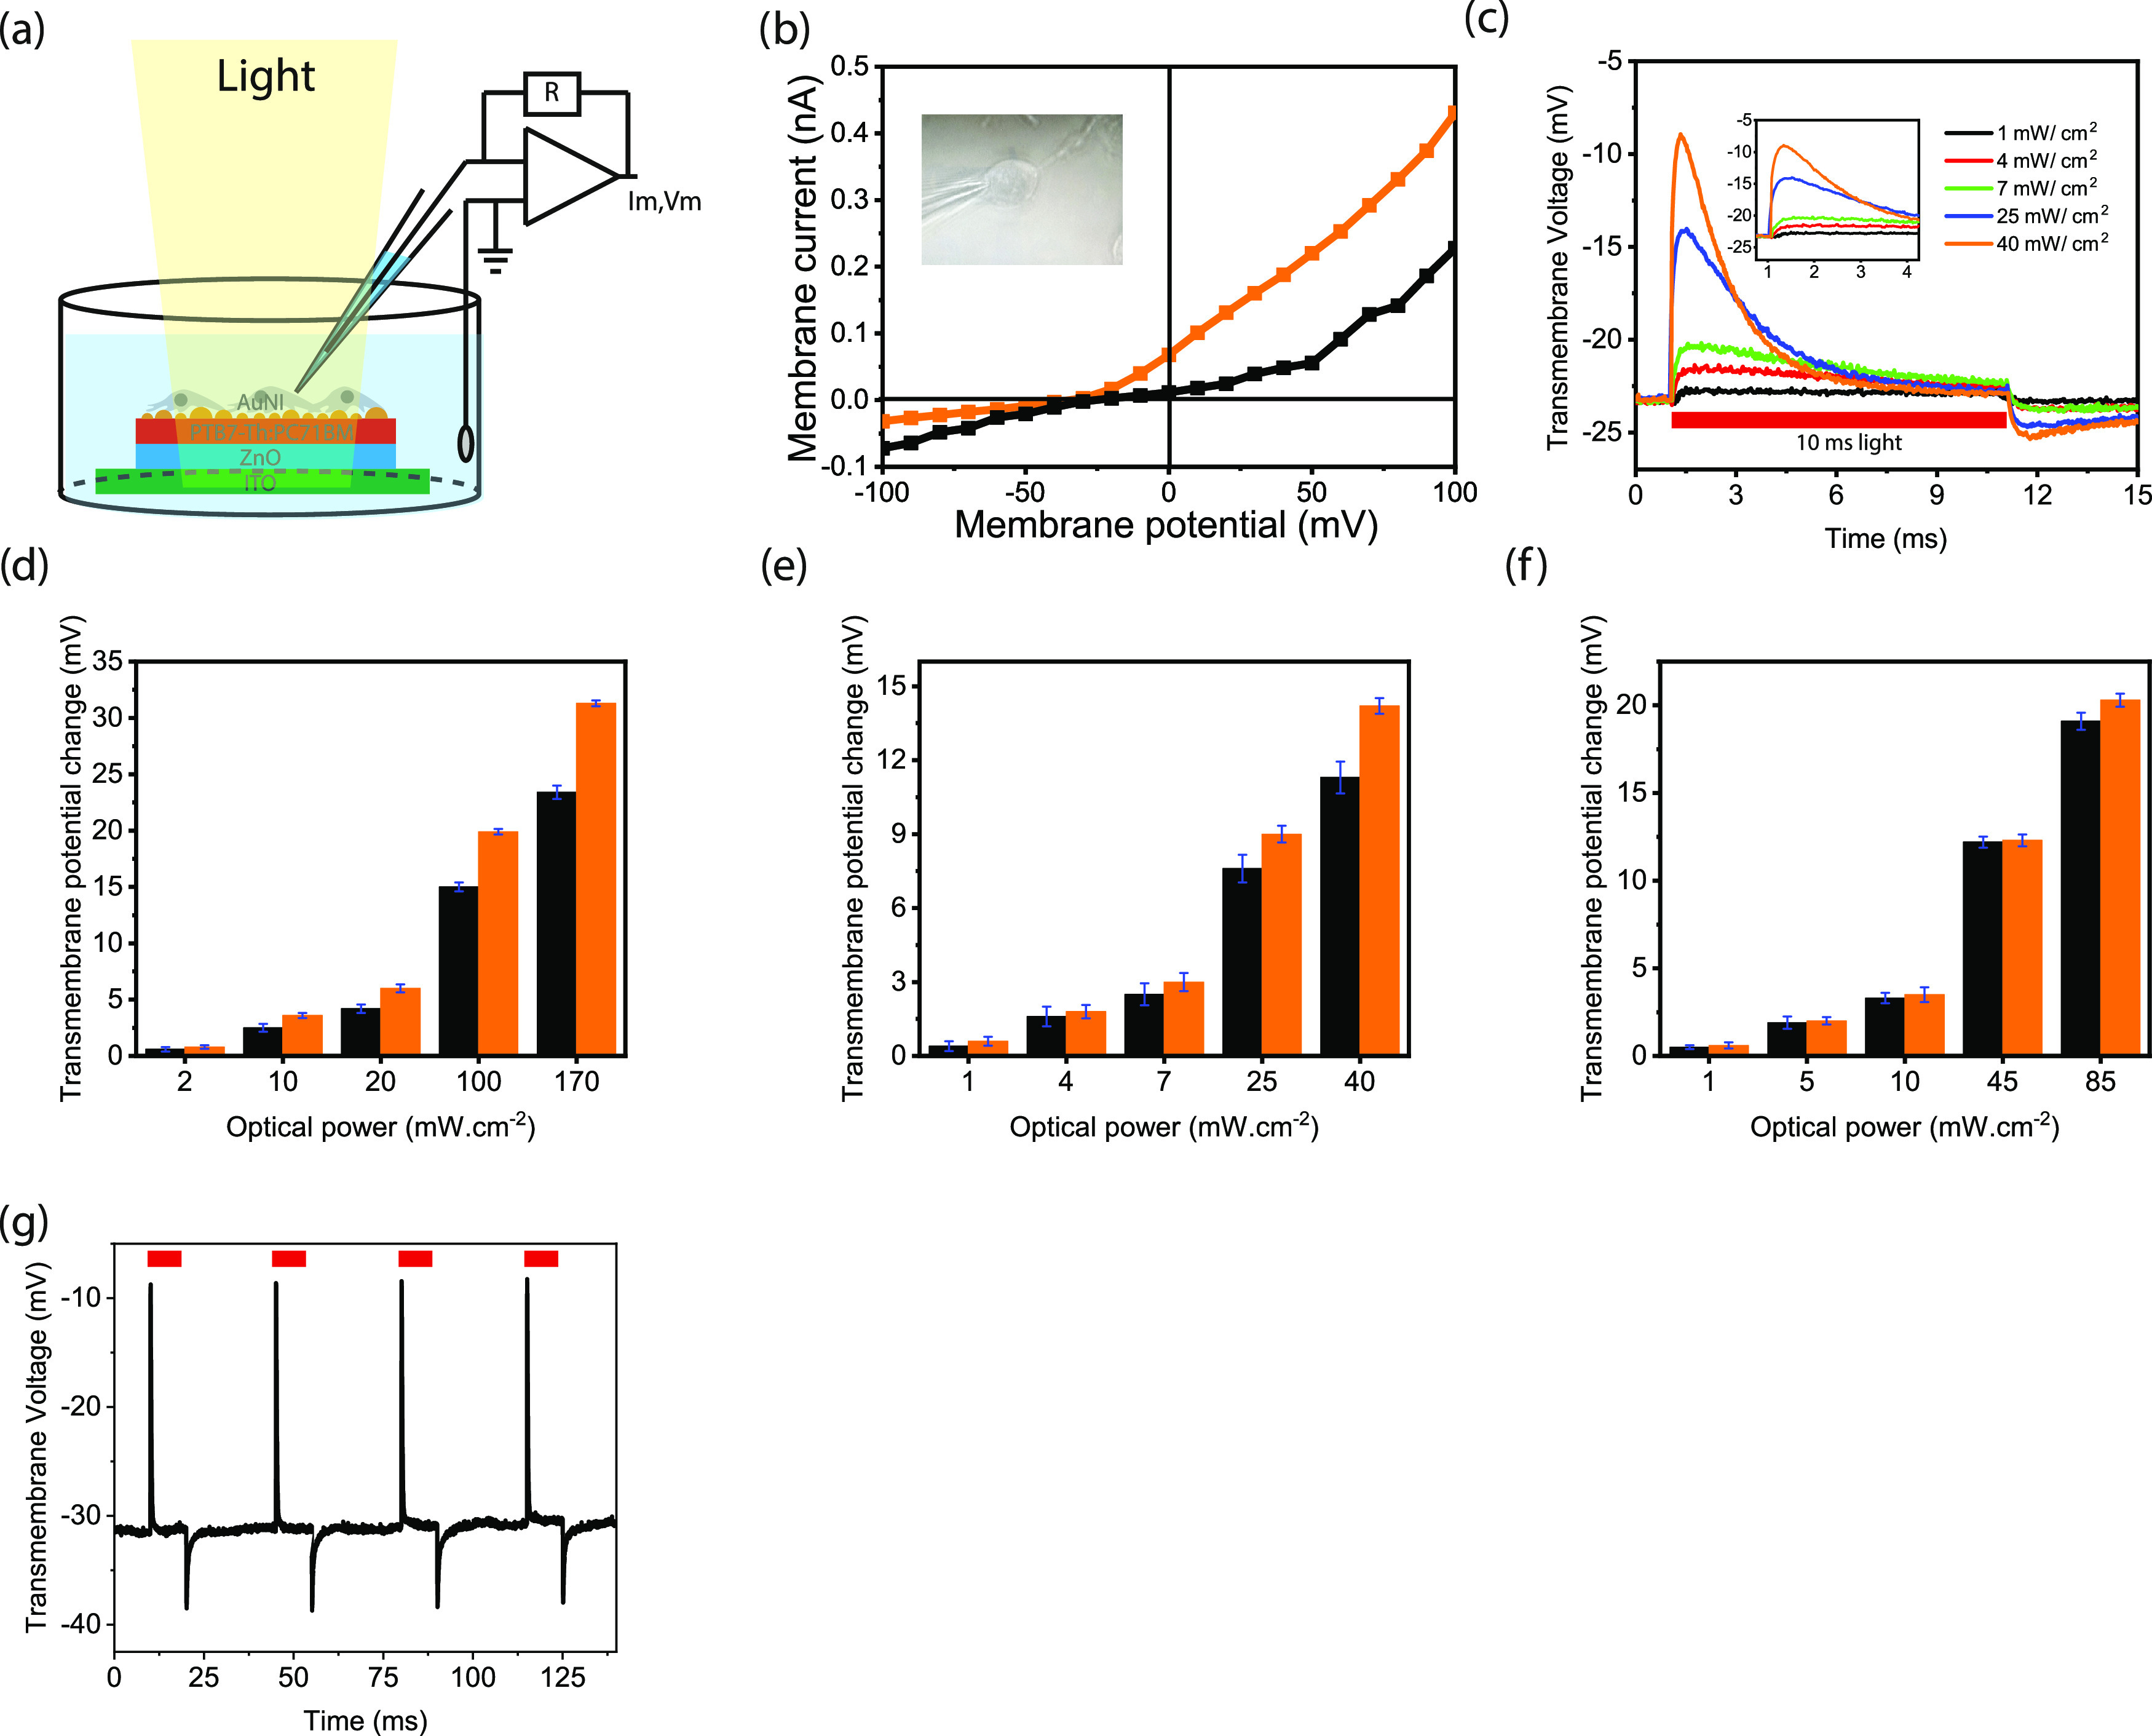
Figure 5.

(a) Schematic of the whole-cell patch-clamp recording configuration of the biointerface in wireless and free-standing modes. The cells are grown on the biointerfaces and adhere to the surface. (b) Current–voltage characteristics of a typical SHSY-5Y cell adhered to the control (black line) and plasmonic (orange line) biointerfaces. The inset shows the photograph of a SHSY-5Y cell on the plasmonic biointerface patched with a glass micropipette. (c) Transmembrane potential variation of SHSY-5Y cells on the plasmonic biointerface under green light illumination with 10 ms pulse width. (d–f) Transmembrane potential variation of SHSY-5Y cells on the control (black) and plasmonic (control) biointerfaces under blue (d), green (e), and red (f) light illumination with 10 ms pulse width. (g) Transmembrane potential under 10 ms pulse width.
