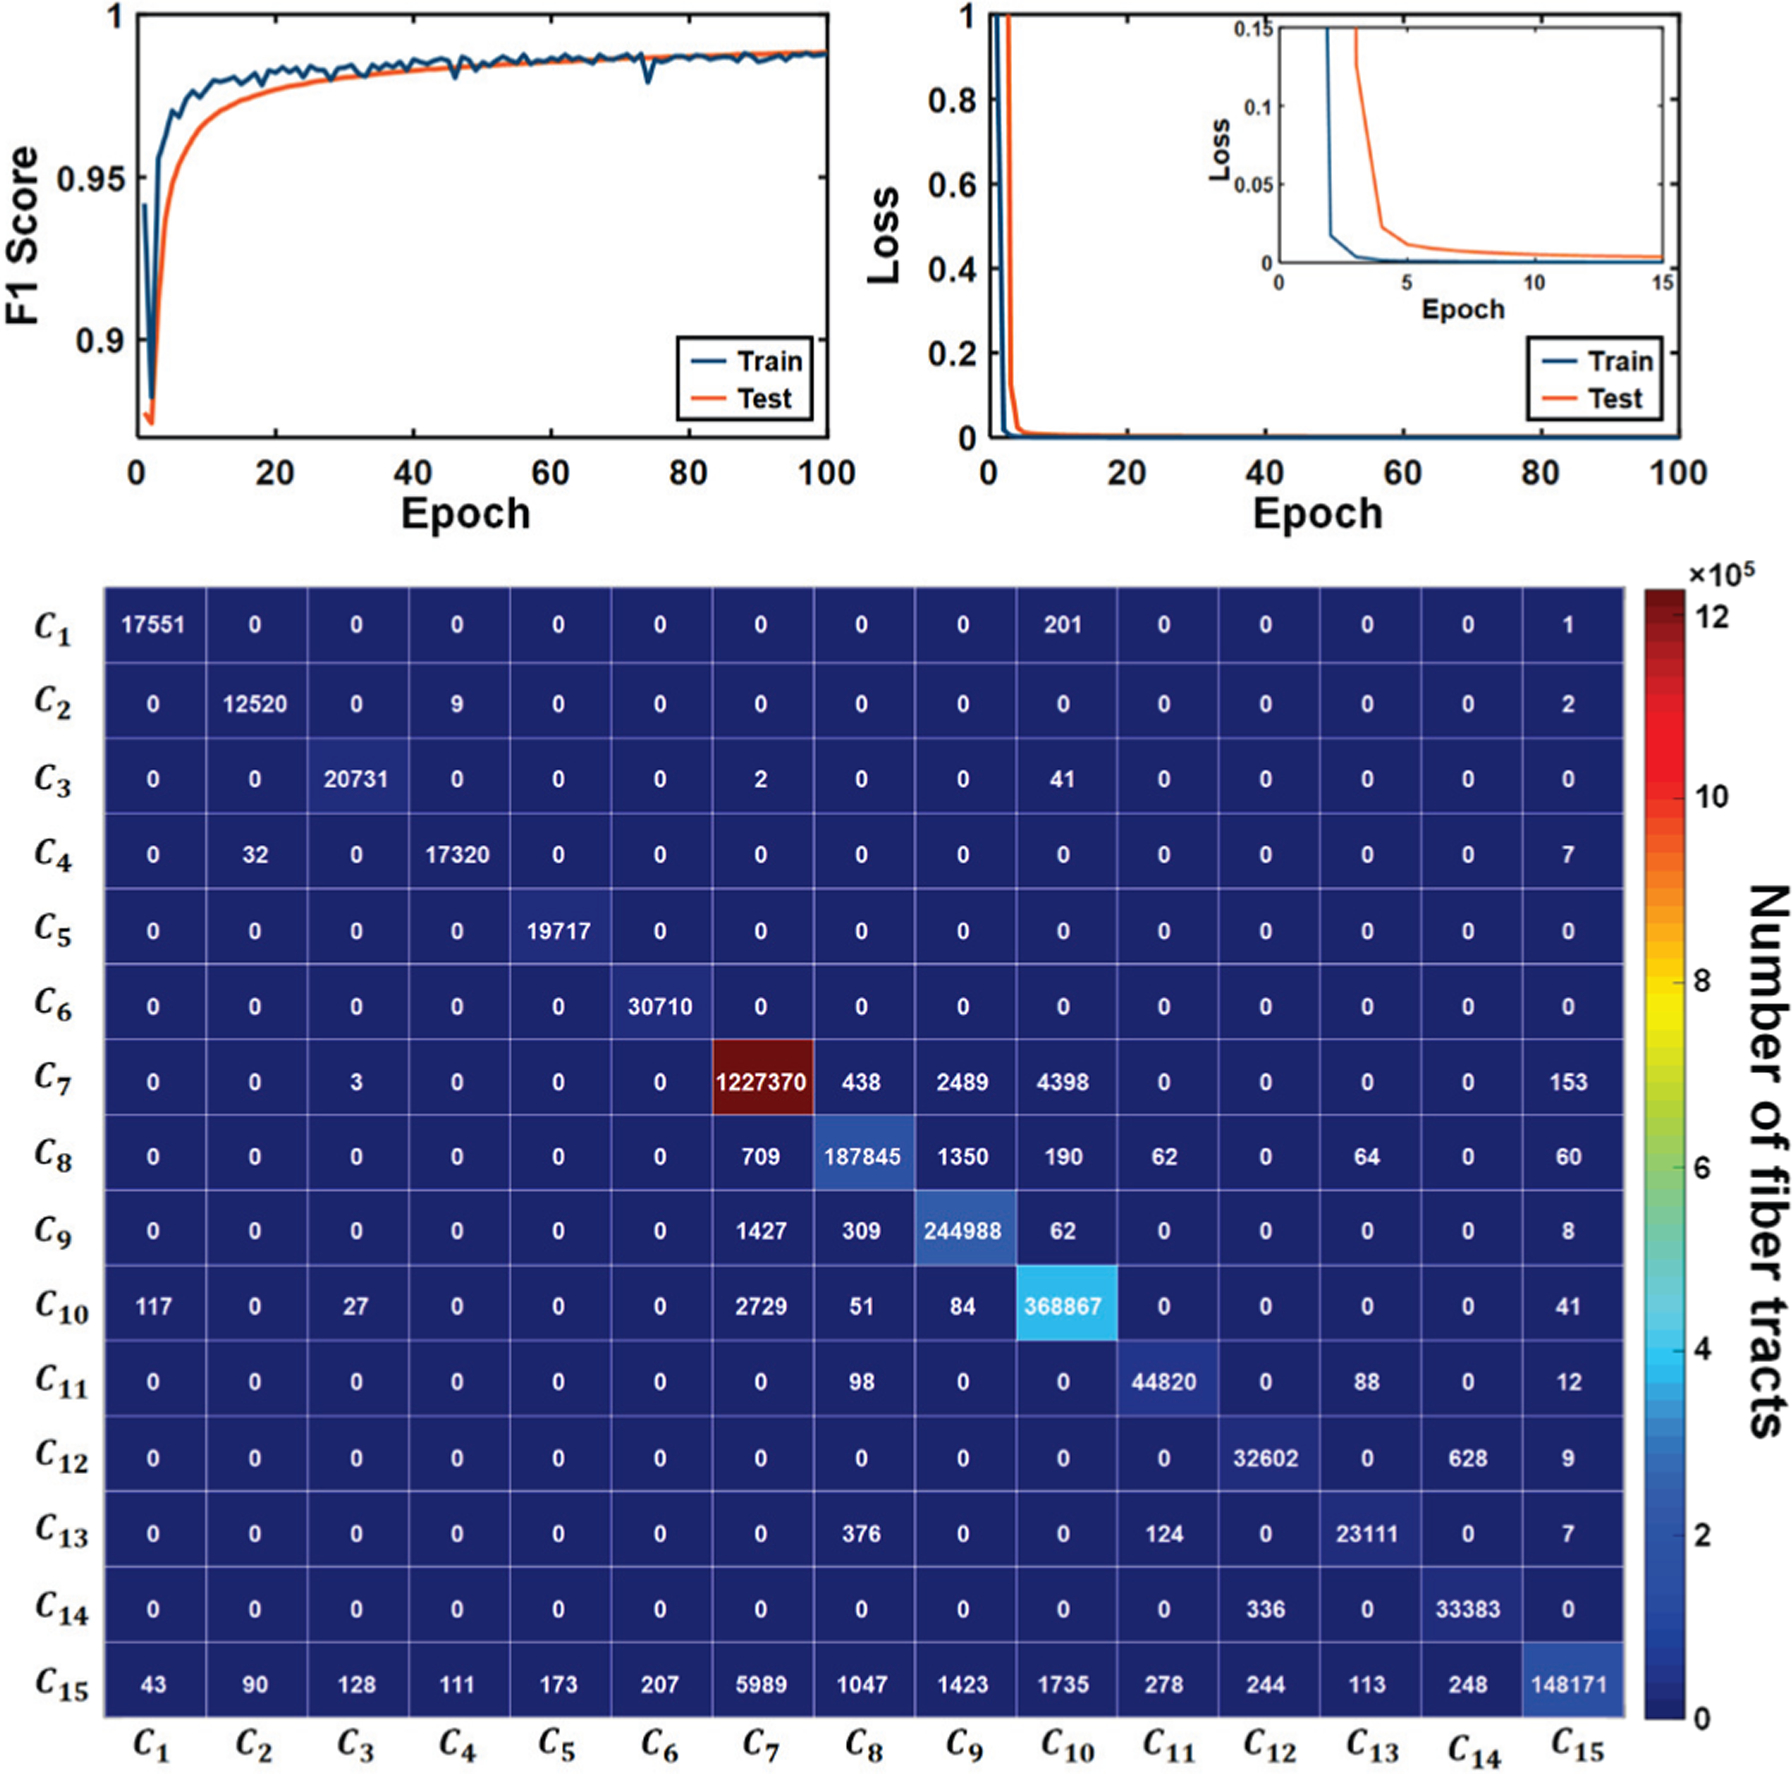
Fig. 3.

Convergence curve of DCNN for training (blue colored curve) and test (orange colored curve) data sets in the top figure. The bottom figure shows the confusion matrix computed on the test set at 96 epochs which showed maximal F1 score (0.9880). The diagonal components of the matrix represent true positives. The sum of column and row for each Ci denote the false positives and false negatives, respectively.
