

Supplemental Digital Content is available in the text
Keywords: drosophila mothers against decapentaplegic protein 7, drosophila mothers against decapentaplegic protein 9, lung adenocarcinoma, prognostic value
Abstract
The lack of effective markers leads to missed optimal treatment times, resulting in poorer prognosis in most cancers. Drosophila mothers against decapentaplegic protein (SMAD) family members are important cytokines in the transforming growth factor-beta family. They jointly regulate the processes of cell growth, differentiation, and apoptosis. However, the expression of SMAD family genes in pan-cancers and their impact on prognosis have not been elucidated. Perl software and R software were used to perform expression analysis and survival curve analysis on the data collected by TCGA, GTEx, and GEO, and the potential regulatory pathways were determined through gene ontology enrichment and kyoto encyclopedia of genes and genomes enrichment analysis. It was found that SMAD7 and SMAD9 expression decreased in lung adenocarcinoma (LUAD), and their expression was positively correlated with survival time. Additionally, SMAD7 could be used as an independent prognostic factor for LUAD. In general, SMAD7 and SMAD9 can be used as prognostic markers of LUAD. Further, SMAD7 is expected to become a therapeutic target for LUAD.
1. Introduction
Transforming growth factor-beta (TGF-β) is distributed in various systems of the human body and is an extremely important type of growth factor that regulates the process of cell differentiation and maturation. It regulates a series of states such as cell migration, growth, differentiation, and apoptosis.[1] Early studies have shown that drosophila mothers against decapentaplegic protein (SMAD) can be directly activated by TGF-β induced cell membrane receptors to form transcription complexes, which further control the transcription of target genes in the nucleus of transcription. Therefore, SMAD protein not only becomes an essential part of the TGF-β signaling pathways but also regulates cell function together.[2] In recent years, it is related to the occurrence and development of various diseases, especially multiple malignant tumors.[3]
Currently, 8 types of SMAD proteins are encoded in the human genome. SMAD1, SMAD5, SMAD9 (SMAD8) belong to the receptor substrates of anti-mullerian-hormone and bone morphogenetic protein in the TGF-β family,[4] SMAD2, and SMAD3 are receptor substrates of activin, TGF-β, and Nodal pathways. SMAD4 assists all R-SMADs. SMAD6 and SMAD7 are inhibitory SMAD proteins.[5] Recent studies have shown that SMAD1 promotes colorectal cancer cell migration.[6] Meanwhile, in lung cancer, blocking SMAD2 and SMAD4 can block the function of TGF-β.[7] SMAD3 can participate in the epithelial-mesenchymal transition (EMT) process of cervical cancer through Long noncoding RNA OIP5-AS1. The expression level of SMAD4 is positively correlated with the survival rate of colon cancer, and the lack of SMAD4 leads to a poor prognosis.[8] Down-regulation of SMAD5 can inhibit nasopharyngeal carcinoma cell proliferation, invasion, and migration.[9] The up-regulation of SMAD6 can promote the appreciation of liver cancer cells.[10] In addition, according to different results, how SAMD7 regulates cancer cell proliferation and migration is still controversial.[11] The expression of SMAD9 is also closely related to the risk of essential hypertension. However, the SMAD family's expression and function in some cancers are still unclear, and there are fewer reports about prognosis, especially in lung cancer. At present, the use of large databases and regulatory networks has been widely accepted in biology, such as the prognostic characteristics of melanoma by transcriptome analysis,[12] and the development of new prognostic models in liver cancer.[13] In this study, a meta-analysis of the expression and prognostic value of SMAD family members in cancer using multiple databases. We explore the expression, prognosis, clinical features, and possible regulatory pathways of SMAD family members in patients with lung adenocarcinoma (LUAD), and provided a theoretical basis for future studies of SMAD family members in LUAD.
2. Materials and methods
2.1. Expression and survival curve of SMAD family genes in cancer
In order to analyze the expression of SMAD family genes in cancer, survival data and expressions of clinical from GTEx, TCGA, and Oncomine databases were summarized to verify the expression of each SMAD family gene in cancer. Oncomine database is a gene chip-based database and integrated data extraction platform. In this database, you can set the conditions for filtering and extracting data according to your own needs (http://www.oncomine.org). In this study, we set the screening conditions as: “Analysis type: cancer vs normal analysis. P-value: .05. Threshold (fold change): 2. Threshold (gene rank): Top 10%.” Meanwhile, The gene expression profling interactive analysis (GEPIA) tool was used to analyze the clinical data of the GTEx and TCGA databases (http://gepia.cancer-pku.cn) and to compare the expression differences of the SMAD family in pan-cancers with their control of normal tissues and its survival.[14] In addition, the Oncomine database was used to analyze the different expression of SMAD families in each lung cancer subtype.
2.2. Analysis of clinical characteristics
The expression data of all genes in LUAD and their corresponding clinical information were extracted from the TCGA database. R software with limma was used to average the repeated data of each expression. In addition, Perl software was used to summarize the information into a matrix. The Wilcox Test was used on a single gene to examine the relationship with clinical characteristics.
2.3. Analysis of differential genes
Log (x+1) processing was performed on data of the extracted TCGA clinical, and the samples were divided into high expression groups and low expression groups according to the median expression of the SMAD7 and SMAD9. R software with limma, pheatmap, and ggplot2 packages was used to filter the original data of the target gene in LUAD and normalize and screen out the differential genes between the 2 groups. The result were displayed using volcanic plots and heatmaps. Differential gene screening criteria: | log FC | ≥2, P. adjust < .05. The clustering method was Euclidean distance.
2.4. Analysis GO and KEGG
The cluster profiler package of R software was used to perform gene ontology (GO) functional analysis and kyoto encyclopedia of genes and genomes (KEGG) pathway analysis on the differential genes screened above, and the differences were screened using P. adjust < .05 as the threshold.[15–17]P. adjust <.05 is the main enrichment function and pathway of screening differential genes for the conditional threshold.
2.5. Analysis of protein interaction network analysis
The selected differential genes were introduced into the search tool for the retrieval of interacting genes. It is an online analysis website for protein-protein interaction (PPI) (https://string-db.org/).[18] The results were imported into Cytoscape software,[19] and key protein expression modules and key node genes were screened.
2.6. Analysis of GEO
The download data of GSE43767 from the database of GEO chips in NCBI (http://www.ncbi.nlm.nih.gov/geo/),[20,21] which includes 113 samples and 29 samples of therapeutic or spontaneous abortion, 15 normal samples and 69 LUAD samples. R software with the limma and beeswarm packages were used to process the obtained data and draw different expression heatmaps and volcano plots.
2.7. Analysis of gene set enrichment
Analysis of TCGA clinical data was used by gene set enrichment analysis (GSEA) with version of 4.0.3.[22,23] According to the expression levels of SMAD7 and SMAD9, they were divided into 2 groups: high expression group and low expression group. The effect of their expression level on the gene set of various biological pathways was analyzed by GSEA. The gene set obtained from the MsigDB database of the GSEA website was used as the reference gene set, and the P-value was calculated 1000 times per analysis cycle according to the weighted method.
2.8. Analysis of independent prognostic factor
R software with survival and survminer packages were used to analyze TCGA clinical data. Both univariate analysis and multivariate analysis were COX proportional hazard regression models.
2.9. Ethical statement
All the data of this paper was obtained from the open-access database, we did not get these data from patients or animals directly, nor intervene these patients. So the ethical approval was not necessary.
3. Result
3.1. Expression of SMAD protein family in pancreatic cancer
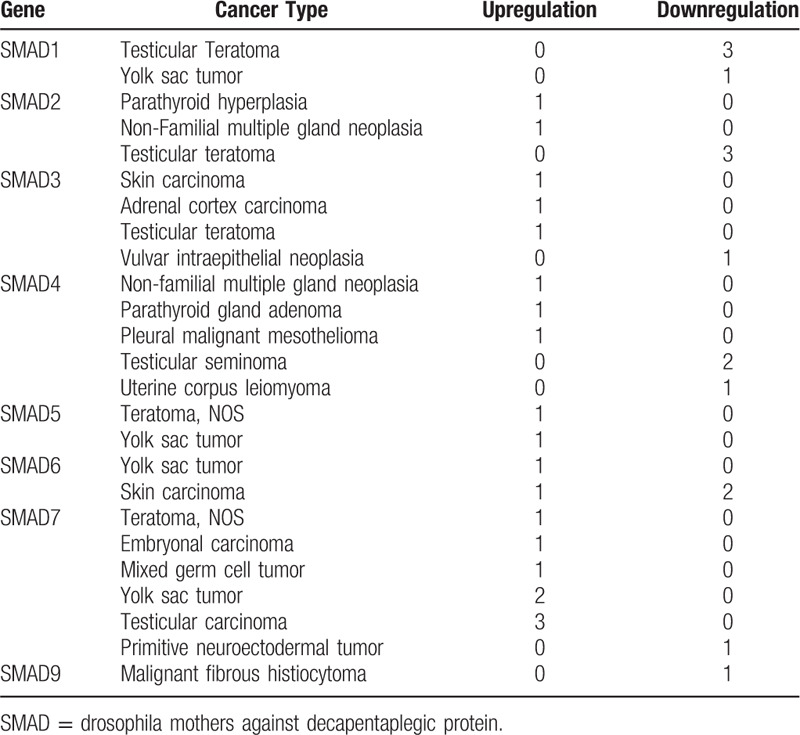
The expression of SMAD protein family members in human cancers at the mRNA level was analyzed by using the Oncomine online database. Analysis of expression differences between cancer and normal tissues according to the selected criteria, the results showed that there were 442, 458, 453, 459, 459, 448, 456, 389 independent studies in the database involving expressions from SMAD1 to SMAD9 (Fig. 1). Interestingly, with the exception of a few SMAD genes that have increased expression in several specific cancers, SMAD protein family members have decreased expression in most cancers. In detail, SMAD1 expression increased in brain and central nervous system (CNS) cancer and lymphoma, the expression of SMAD5 increased in brain and CNS cancer, colorectal cancer and kidney cancer, SMAD6 expression increased in esophageal cancer, and SMAD9 expression increased in brain and CNS cancer. However, in the other cancer data, as shown in Table 1, except for testicular cancer, most members of the SMAD protein family have decreased expression, and there is no significant expression difference in other types of cancer.
Figure 1.
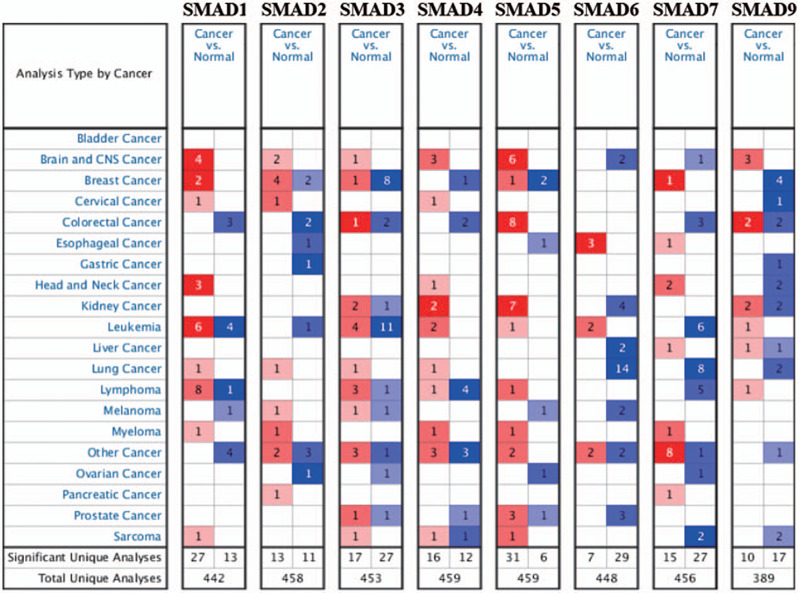
Analysis of the mRNA expression of drosophila mothers against decapentaplegic protein family genes (cancer tissue vs normal tissue) from the Oncomine database. The Oncomine database was used to analyze. The number of statistically significant datasets from data filtered by the screening criteria. Red represents increased expression, blue represents decreased expression, and each group of underground numbers represents the total number of studies.
Table 1.
Expression of drosophila mothers against decapentaplegic protein famliy in other cancers in Oncomine.
In order to further determine the expression difference of SMAD protein family between cancer and normal tissues, the TCGA and GTEx database was used to jointly analyze the expression difference of SMAD protein family in 31 cancers, and a heatmap was drawn (Fig. 2). The expression of SMAD family genes were used t test to calculate the P value of tumor tissue and normal tissue (Figs. S1–S8). And found the intersection of the results of TCGA and GTEx and the results of Oncomine database. Compared with normal tissues, it was found that the expressions of SMAD1, SMAD4, SMAD5, and SMAD7 were significantly different in brain lower grade glioma. In invasive breast carcinoma, SMAD9 expression was significantly different. There are significant differences in the expression of SMAD1 in acute myeloid leukemia, significant differences in the expression of SAMD6, SMAD7, and SMAD9 in LUAD, and the expression of SMAD1 and SMAD7 in lymphoid neoplasm diffuse large B-cell lymphoma. There are significant differences in the expression of SMAD6 in prostate adenocarcinoma, and significant differences in the expression of SMAD1 and SMAD7 in testicular germ cell tumors.
Figure 2.
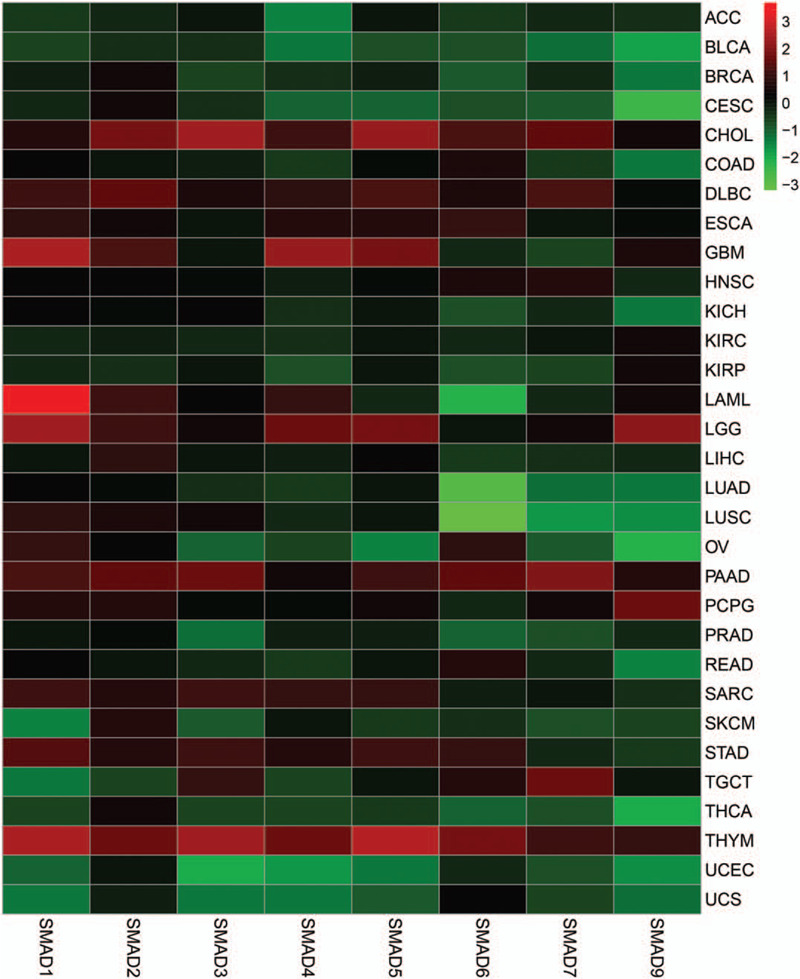
Analysis of drosophila mothers against decapentaplegic protein family gene expression of GTEx and TCGA databases. Heatmaps show the logFC value of drosophila mothers against decapentaplegic protein family members in all types of cancer. The color label indicates the different logFC values.
3.2. Prognostic analysis of SMAD protein family
To determine the prognostic values of the genes selected, Kaplan–Meier survival analysis was conducted on the genes selected above based on the clinical information in the TCGA database. In LUAD, SMAD6 (log-rank P = .65, P (HR) = .66) cannot show an obvious correlation with overall survival (Fig. 3). Similarly, in all other cancers that have been analyzed, the differential genes for other SMAD protein families also showed the same negative results as SMAD6. However, in LUAD, both SMAD7 (log-rank P = .0099, p (HR) = 0.01) and SMAD9 (log-rank P = .0017, P (HR) = .0019) shown in figure showed positive results (Fig. 3). The prognosis of SMAD7 and SMAD9 high expression groups were significantly better than that of low expression groups.
Figure 3.
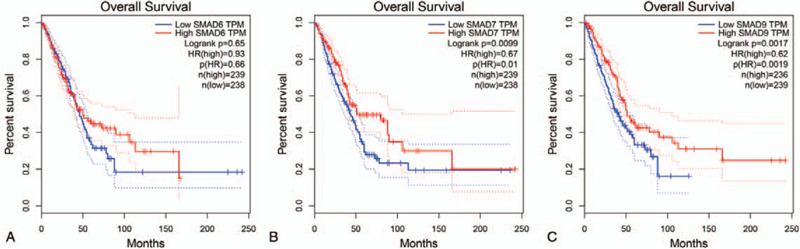
Prognostic value of drosophila mothers against decapentaplegic protein family in lung adenocarcinoma. Survival curves were drawn in K-M method, and survival curve was tested by COX and log-rank.
3.3. Clinical features of SMAD7 and SMAD9
In order to evaluate the clinical characteristics of SMAD7 and SMAD9, we extracted the expression data of SMAD7 and SMAD9 in TCGA in different types of lung cancer. they showed the same results as that from the combined analysis of TCGA and GTEx (Fig. 4A). In LUAD, the expressions of SMAD7 (P = 1.76 × 10⁻¹²) and SMAD9 P = 1.64 × 10⁻¹²) were reduced compared to normal tissues. However, as shown in figure (Fig. 4B.C.D), after analyzing their stage, gender, age, and expression, it was found that the expression of SMAD7 has nothing to do with the stage, gender, and age. In SMAD9 (Fig. 4E.F.G), although there are differences between Stage1 and Stage3 (P = 1.07 × 10⁻²), there is no continuous difference. Thus, the expression of SMAD9 is independent of the stages. On the other hand, SMAD9 expression was slightly higher in women than that in men (P = 2.07 × 10⁻²). In addition, the expression of SMAD9 is higher in young patients, but it is worth noting due to the insufficient sample size of young patients (n = 12).
Figure 4.
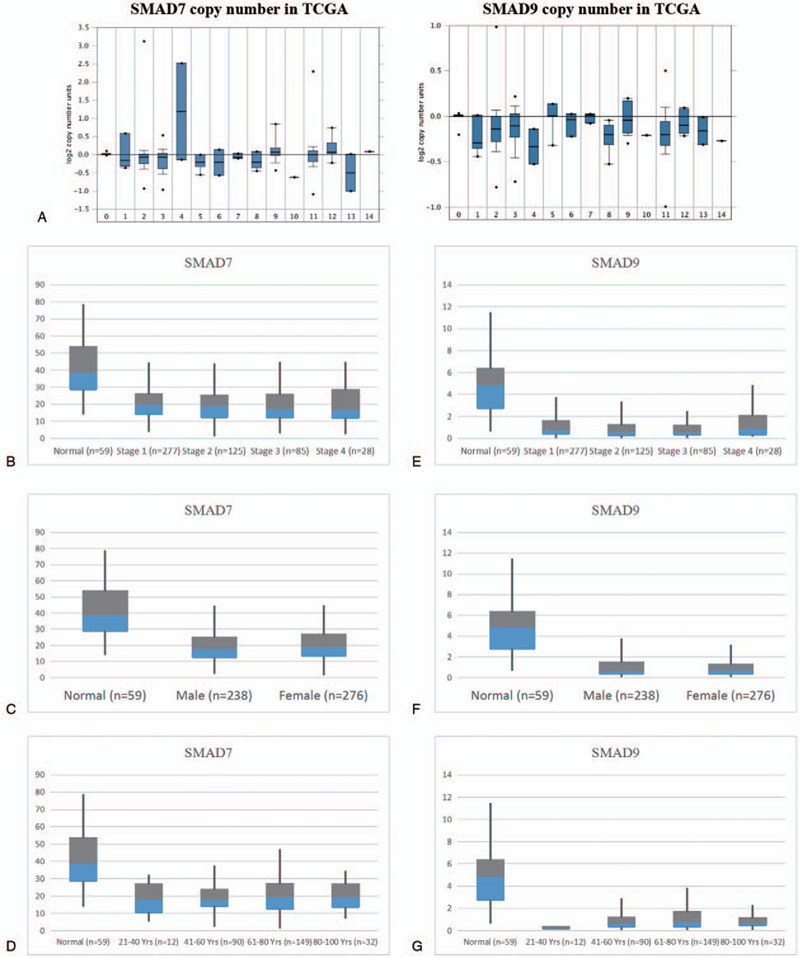
Clinical characteristics of SMAD7 (drosophila mothers against decapentaplegic protein) and SMAD. (A) Box plots indicate the mRNA expression levels of SMAD7 and SMAD9 in different types of lung cancer in the TCGA database. The values are normalized by log2. 0 = Normal (810); 1: acinar lung adenocarcinoma (LUAD) (6); 2: LUAD (261); 3: LUAD, mixed subtype (67); 4: lung clear cell adenocarcinoma (2); 5: lung mucinous adenocarcinoma (6); 6: micropapillary LUAD (3); 7: mucinous bronchioloalveolar carcinoma (3); 8:non-mucinous bronchioloalveolar carcinoma (9); 9: papillary LUAD (10); 10:solid LUAD (1); 11:squamous cell lung carcinoma (348); 12:squamous cell lung carcinoma, basaloid variant (8); 13:squamous cell lung carcinoma, papillary variant (2); 14:squamous cell lung carcinoma, small cell variant (1). (b) Expression of SMAD7 in LUAD at different stages. (C) Expression of SMAD7 in LUAD of different genders. (D) Expression of SMAD7 in LUAD at different ages. (E) Expression of SMAD9 in LUAD at different stages. (F) SMAD9 expression in LUAD of different genders. (G) SMAD9 expression in LUAD at different ages. The value is normalized by log2 (TPM + 1) for log-scale, ∗ is the significant differences (P<.05) after t test.
3.4. Differentially expressed genes (DEGs) in TCGA
The data of LUAD in TCGA were divided into 2 groups of high expression and low expression according to the target gene median, and the DEG was used to screen the gene expression data between the 2 groups with limma in R software. According to the grouping result, a total of 12 DEGs of SMAD7 and 57 DEGs of SMAD9 were identified from the TCGA database (Fig. 5A.B).
Figure 5.
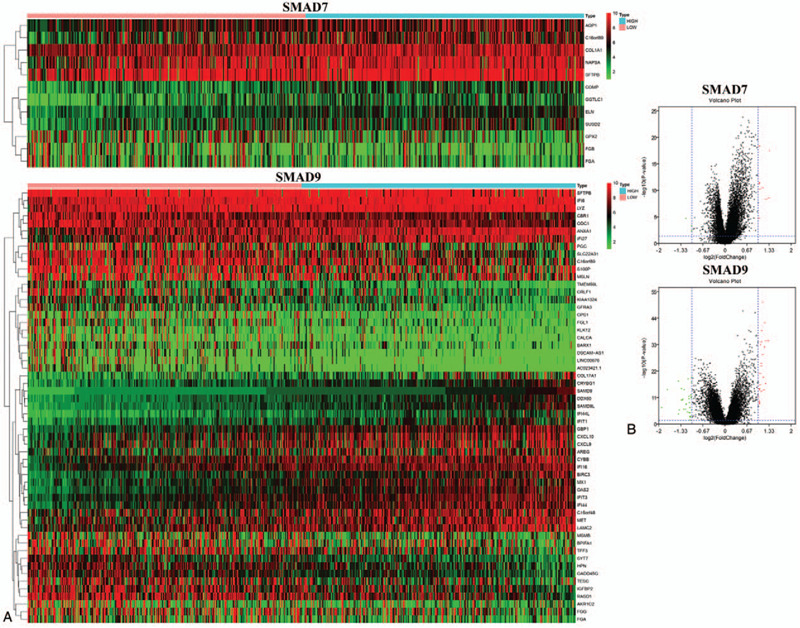
Heatmap and volcano plot of differential gene expression of drosophila mothers against decapentaplegic protein 7 and drosophila mothers against decapentaplegic protein 9. (A) Heatmap of Differentially expressed genes screened based on clinical data from TCGA database. (B) Volcano plot of the differentially expressed genes. Red indicates genes that are up-regulated and green indicates genes that are down-regulated.
3.5. GO and KEGG enrichment analysis of differential genes
Cluster Profiler, org.Hs.eg.db, richplot, and ggplot2 packages in R software were employed to analyze the functions of DEGs in LUAD. The results show that in GO enrichment, SMAD7 mainly participates in the function of the regulation of blood vessels. SMAD9 is mainly involved in the function of zymogen activation (Fig. 6A). In the KEGG enrichment, SMAD7 is mainly involved in functions such as protein digestion and absorption, and SMAD9 is mainly involved in functions such as the NOD-like receptor signaling pathway (Fig. 6B).
Figure 6.
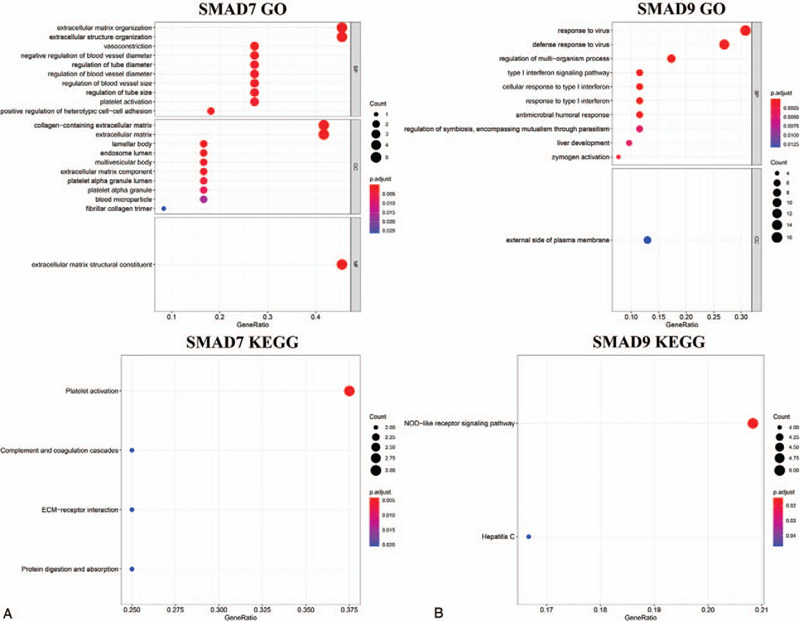
gene ontology enrichment analysis and kyoto encyclopedia of genes and genomes enrichment analysis of differentially expressed genes. (A) Drosophila mothers against decapentaplegic protein 7. (B) Drosophila mothers against decapentaplegic protein 9. The abscissa is the Rich factor. A larger value indicates a greater degree of enrichment. The ordinate is a pathway term with a higher degree of enrichment. The p value is the p value that has undergone multiple checks. The redder the color, the smaller the p value, indicating that the enrichment is more obvious. The size of the dot indicates the number of differential genes in the term, and the larger the dot, the more genes there are. BP = biological processes, CC = cellular components, MF = molecular functions.
3.6. GSEA of the TCGA
Although DEGs have been used for GO and KEGG enrichment, it only screened for differential expressions and did not involve the degree and direction of differential gene expressions. Therefore, the function of SMAD7 and SMAD9 in LUAD was further analyzed by using GESA. In the GO and KEGG enrichment analysis results, SMAD7 positive mainly regulates processes such as cellular respiration and RNA degradation, but SMAD7 negative mainly regulates processes such as regulation of cellular response and leukocyte transendothelial migration (Fig. 7A.B). SMAD9 positive mainly regulates the processes such as chronic inflammatory response and galactose metabolism, while SMAD9 negative mainly regulates the processes such as lung alveolus development and GNRH signaling pathway (Fig. 8A.B). These enrichment analysis results can better help us understand how SMAD7 and SMAD9 participate in the regulation of LUAD.
Figure 7.
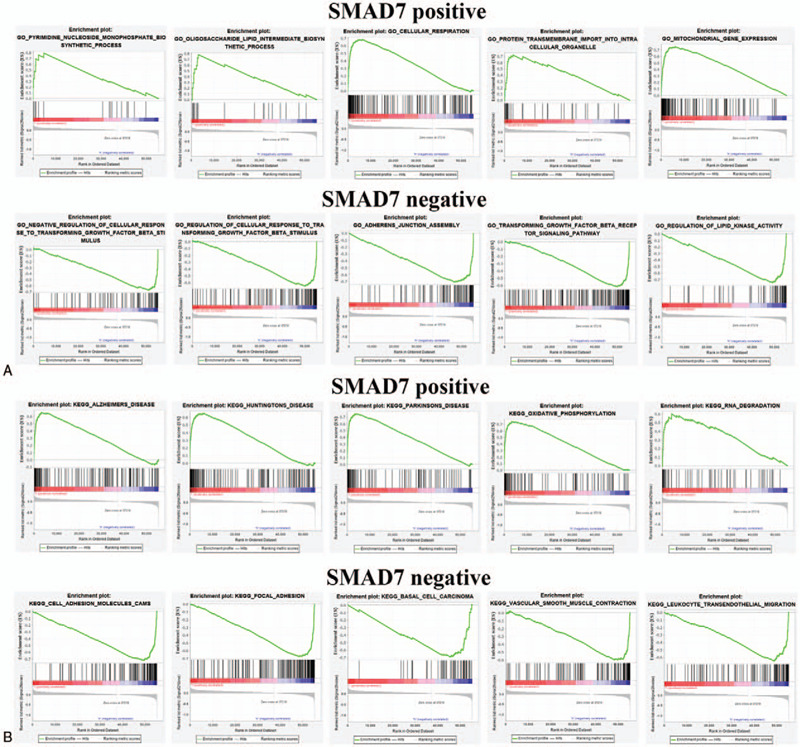
gene ontology and kyoto encyclopedia of genes and genomes enrichments analyses of drosophila mothers against decapentaplegic protein 7 by using gene set enrichment analysis. (A) Top 5 positive enrichment scores. (B) Top 5 negative enrichment scores.
Figure 8.
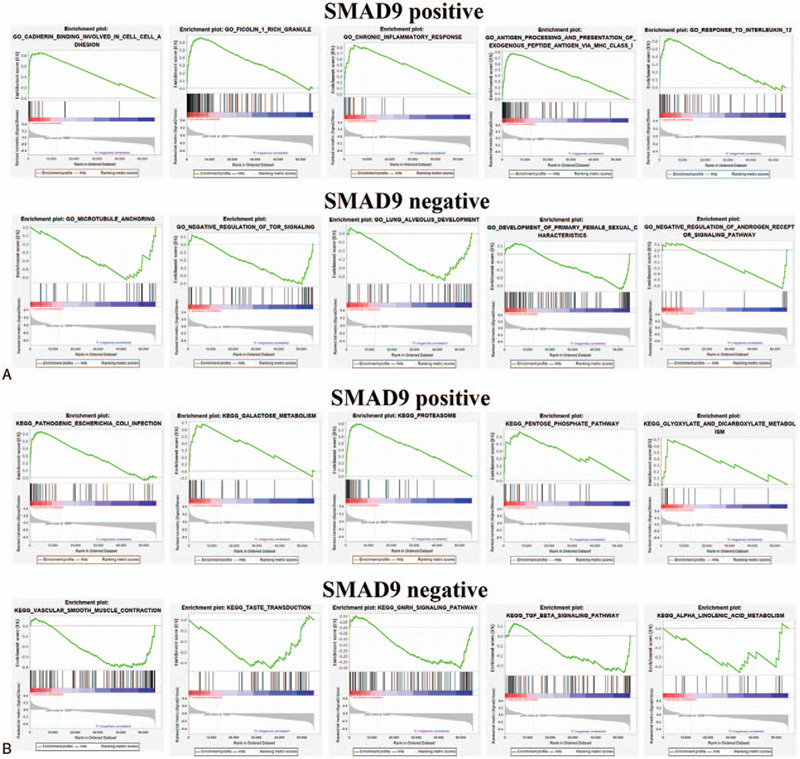
gene ontology and kyoto encyclopedia of genes and genomes enrichments of genes by drosophila mothers against decapentaplegic protein 9 analyzed using gene set enrichment analysis. (A) Top 5 positive enrichment scores. (B) Top 5 negative enrichment scores.
3.7. The network of DEGs PPI
The PPI network helps us to explore further the molecular mechanism of SMAD7 and SMAD9 in LUAD. The search tool for the retrieval of interacting genes network tool was used to analyze the identified DEGs. After hiding the disconnected nodes in the network for SMAD7 (Fig. 9A), the PPI network of the DEGs consisted of 12 nodes and 15 edges. The top 5 of predicted functional partners are FGG, COL1A2, F2, SERPINC1, and LOX. Mainly through platelet aggregation, common pathway of fibrin clot formation (FDR = 1.05 × 10⁻¹⁰), integrin cell surface interactions (FDR = 1.14 × 10⁻⁹), extracellular matrix organization (FDR = 2.58 × 10⁻⁹) and GRB2: SOS provides linkage to MAPK signaling for Integrins (FDR = 4.79 × 10⁻⁶), which regulates the occurrence and development of LUAD. For SMAD9 (Fig. 9B), the PPI network of the DEGs consisted of 54 nodes and 238 edges. The top 5 of predicted functional partners are FGB, HGF, F2, TRAF2, and OASL, which mainly involved in the immune system (FDR = 1.05 × 10⁻⁷), interferon alpha/beta signaling (FDR = 2.22 × 10⁻⁷), cytokine signaling in immune system (FDR = 5.45 × 10⁻⁷) and interferon signaling (FDR = 6.62 × 10⁻⁶), the finding showed that SMAD7 and SMAD9 are mainly regulated the occurrence and development of LUAD.
Figure 9.
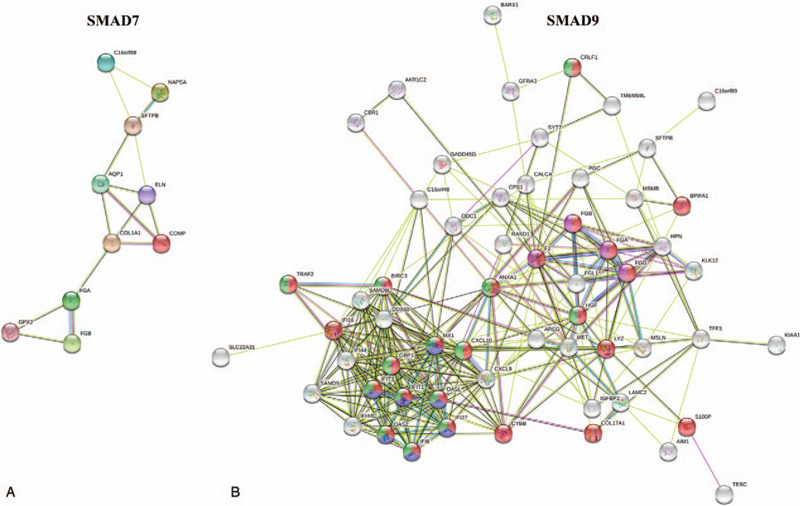
Differentially expressed genes (DEG's) protein-protein interaction (PPI) network. (A) PPI network between DEGs of drosophila mothers against decapentaplegic protein 7. (B) PPI network between DEGs of drosophila mothers against decapentaplegic protein 9. All disconnected nodes are hidden.
3.8. Identification of the expression of SMAD7 and SMAD9 in GSE43767
GSE43767 is a microarray study based on normal and LUAD patients. It includes data from 15 normal lung tissue samples and lung tissue from 69 LUAD patients. The samples were analyzed using the limma package in R software. The results showed (Fig. 10) that the expression of SMAD7 and SMAD9 was significantly reduced in cancer patients.
Figure 10.
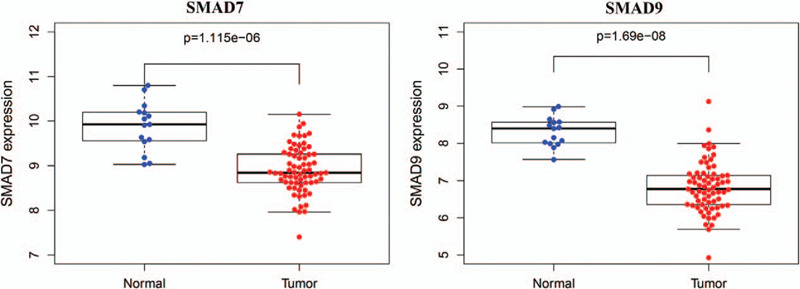
Expressions of drosophila mothers against decapentaplegic protein 7 and drosophila mothers against decapentaplegic protein 9 of the GSE43767 dataset in the GEO database. The ordinate is the expression value after taking log (x + 1) for the data result.
3.9. SMAD7 is an independent prognostic factor for LUAD
The clinical information of LUAD patients was extracted from the TCGA database, and some clinical information samples with some missing data were deleted, and the survival and survminer packages in R software were employed to analyze the data using the COX risk ratio model in with the expression of SMAD7 and SMAD9. It was shown (Table 2) that in SMAD7, both the results obtained based on univariate Cox regression analysis (P = 1.42 × 10⁻²) or multivariate cox regression analysis (P = 4.88 × 10⁻⁴) are statistically significant (Fig. 11A), indicating that SMAD7 can be used as an independent prognostic factor for LUAD. Unfortunately, SMAD9 cannot be used as an independent prognostic factor (P = .086) (Fig. 11B).
Table 2.
Analysis of independent prognostic factor.
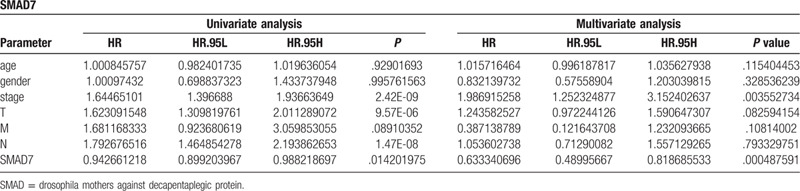
Figure 11.
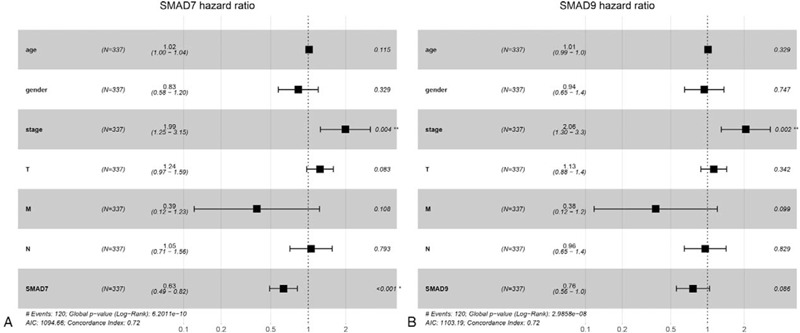
Multi-factor COX analysis forest map of drosophila mothers against decapentaplegic protein 7 and drosophila mothers against decapentaplegic protein 9.
4. Discussion
At present, lung cancer is one of the first high-incidence malignancies among all tumors.[24] Histopathologically, it can be divided into non-small cell lung cancer and small cell lung cancer. Epidemiological statistics show that clinically, non-small cell lung cancer accounts for the vast majority. Non-small cell lung cancer can be divided into squamous cell carcinoma, adenocarcinoma, and large cell lung cancer and other types.[25] LUAD is a primary epithelial tumor of the lung, which mostly originates from the bronchial mucosal epithelium or alveolar epithelium. In recent years, the incidence of LUAD has continued to rise and has now become the most common type of lung cancer worldwide.[26] Unlike lung squamous cell carcinoma, which mostly manifests as central lung cancer, most LUADs occur in the peripheral parts of the lung, and there are no obvious clinical symptoms in the early stage, leading to a poor prognosis. Timely detection and operation can effectively improve patients with the LUAD survival rate.[27]
The SMAD signaling pathway is a crucial pathway for the TGF-β transcription factor family to regulate cell proliferation, differentiation, metabolic migration, localization, and apoptosis.[2] As an essential family of transcription factors, studying SMAD family genes can better allow us to understand the occurrence and metastasis of cancer, and thus develop new therapeutic approaches. Although many pathways have been reported, the pathways in some cancers have not been elucidated.
In this study, GTEx, TCGA, and GEO databases were used to analyze the expression of SMAD family in different cancers, and systematically to compare the mRNA expression differences of SMAD family genes in normal tissues and cancer tissues. At the same time, based on the screening results, the expression profile of the SMAD family in LUAD was systematically revealed. These results show that the SMAD family plays an essential role in the development of LUAD.
So far, there have been many studies on SMAD1 expression. In hepatocellular carcinoma, the expression of SMAD1/SMAD5/SMAD8 is reduced compared to normal tissues, but they are not potential biomarkers for hepatocellular carcinoma.[28] In prostate cancer, the expression of SMAD1 is increased.[29] However, there are no reports of SMAD1 on cancer prognosis. Similarly, SMAD2 is also involved in the regulation of many cancers. According to a study in 2018, overexpression of ATF4 can affect the survival rate of triple-negative breast cancer patients through SMAD2.[30] Moreover, there is strong evidence that silencing SMAD2 can inhibit TGF-β function.[31] However, a previous study showed that the absence of SMAD2 could lead to reduced differentiation and increased EMT levels, leading to tumor metastasis.[32] At the same time, in patients with non-small cell lung cancer, high expression of p-SMAD2 is predictive of poor clinical survival.[33] Like SMAD2, SMAD3 is considered a tumor suppressor. In lung cancer, the deletion of SMAD3 can inhibit the pathway of tumor growth through TGF-β, thereby promoting tumorigenicity.[34] Moreover, in lung cancer, the expression of SMAD3 increased. Although the number of samples studied in Oncomine was insufficient, it was consistent with our findings. It shows that our research has potential value.[35] Multiple reports have shown that SMAD4 is a tumor suppressor gene. For example, in pancreatic cancer, SMAD4 expression is reduced. The same is true for colorectal cancer.[36,37] Moreover, special studies have shown that high expression of SMAD4 can prolong the survival time of patients. Although SMAD4 cannot be used as an independent prognostic factor, it can be used as an independent prognostic factor in combination with p-SMAD2.[38] For SMAD5, it has been reported that miR-145 can promote the migration and migration of esophageal cancer cells by inhibiting theexpression of SMAD5.[39] Fstl1 can promote glioma growth through SMAD1/SMAD5/SMAD8.[40] At the same time, SMAD5 expression increases in prostate cancer, which is closely related to postoperative survival.[39] For the SMAD6 gene, high expression of it can promote the development of glioma.[41] Similarly, high expression of SMAD7 can lead to a poor prognosis for acute myeloid leukemia.[42] Unfortunately, the high expression of SMAD9 increases the EMT risk of oral squamous cell carcinoma.[43] These findings reveal that the SMAD family plays an important role in the development of cancer. In this study, SMAD7 and SMAD9 were significantly reduced in lung cancer. Moreover, the expression of SMAD7 and SMAD9 is significantly correlated with the prognosis survival of patients. Through enrichment analysis, it was found that SMAD7 and SMAD9 mainly regulate the occurrence and development of lung cancer through the regulation of cellular response and GNRH signaling pathway pathways. At the same time, SMAD7 can be used as an independent prognostic factor to provide earlier detection and use of new treatments for lung cancer. Taken together, these results suggest that SMAD7 and SMAD9 may be markers and new therapeutic targets for LUAD. Correspondingly, these results need to be further verified by specific experiments.
Author contributions
Xing-Hua Liao designed research; Xing-Hua Liao, Yuan Xiang, and Zhou-Tong Dai performed research, Jia Peng Li, Hui-Min Zhang, Zhou-Tong Dai, and Jun Wang analyzed data; and Xing-Hua Liao, Hui-Min Zhang wrote the paper. Kai Zhao and Zhou-Tong Dai. participated in the revision process of the manuscript. All authors read and approved the final manuscript.
Data curation: Zhou-Tong Dai, Jun Wang.
Formal analysis: Yuan Xiang.
Funding acquisition: Xing-Hua Liao.
Investigation: Zhou-Tong Dai, Yuan Xiang.
Methodology: Zhou-Tong Dai, Yuan Xiang.
Project administration: Xing-Hua Liao.
Resources: Jia Peng Li.
Software: Jun Wang, Hui-Min Zhang.
Supervision: Jia Peng Li.
Validation: Jia Peng Li.
Visualization: Jia Peng Li, Xing-Hua Liao.
Writing – original draft: Zhou-Tong Dai.
Writing – review & editing: Zhou-Tong Dai, Kai Zhao, Hui-Min Zhang, Zi Tan Peng.
Supplementary Material
Footnotes
Abbreviations: CNS = central nervous system, DEG = Differentially expressed genes , EMT = epithelial-mesenchymal transition, GO = gene ontology, GSEA = gene set enrichment analysis, KEGG = kyoto encyclopedia of genes and genomes, LUAD = lung adenocarcinoma, PPI = protein-protein interaction, SMAD = drosophila mothers against decapentaplegic protein, TGF-β = transforming growth factor-beta.
How to cite this article: Dai Z-T, Wang J, Zhao K, Xiang Y, Li JP, Zhang H-M, Peng Z-T, Liao XH. Integrated TCGA and GEO analysis showed that SMAD7 is an independent prognostic factor for lung adenocarcinoma. Medicine. 2020;99:44(e22861).
This work was financially supported by National Natural Science Foundation of China (No. 31501149, 31770815, 31570764) and Hubei Natural Science Foundation (2017CFB537, 2019CFB529) and Educational Commission of Hubei (B2017009). Hubei Province Health and Family Planning Scientific Research Project (WJ2017M173, WJ2019M255) and the Applied Basic Research Project of Wuhan City (No. 2017060201010193) and the Science and Technology Young Training.
All authors have read this manuscript and approved for the submission.
The authors have no conflicts of interest to disclose.
The datasets generated during and/or analyzed during the current study are publicly available.
References
- [1].Wan M, Li C, Zhen G, et al. Injury-activated transforming growth factor beta controls mobilization of mesenchymal stem cells for tissue remodeling. Stem Cells 2012;30:2498–511. [DOI] [PMC free article] [PubMed] [Google Scholar]
- [2].Schmierer B, Hill CS. TGFbeta-SMAD signal transduction: molecular specificity and functional flexibility. Nat Rev Mol Cell Biol 2007;8:970–82. [DOI] [PubMed] [Google Scholar]
- [3].Pangas SA. Bone morphogenetic protein signaling transcription factor (SMAD) function in granulosa cells. Mol Cell Endocrinol 2012;356:40–7. [DOI] [PMC free article] [PubMed] [Google Scholar]
- [4].Wiegman EM, Blaese MA, Loeffler H, et al. TGFbeta-1 dependent fast stimulation of ATM and p53 phosphorylation following exposure to ionizing radiation does not involve TGFbeta-receptor I signalling. Radiother Oncol 2007;83:289–95. [DOI] [PubMed] [Google Scholar]
- [5].Koller H, Hitzl W, Acosta F, et al. In vitro study of accuracy of cervical pedicle screw insertion using an electronic conductivity device (ATPS part III). Eur Spine J 2009;18:1300–13. [DOI] [PMC free article] [PubMed] [Google Scholar]
- [6].Yang D, Hou T, Li L, et al. SMAD1 promotes colorectal cancer cell migration through Ajuba transactivation. Oncotarget 2017;8:110415–25. [DOI] [PMC free article] [PubMed] [Google Scholar]
- [7].Chae DK, Ban E, Yoo YS, et al. MIR-27a regulates the TGF-beta signaling pathway by targeting SMAD2 and SMAD4 in lung cancer. Mol Carcinog 2017;56:1992–8. [DOI] [PubMed] [Google Scholar]
- [8].Isaksson-Mettavainio M, Palmqvist R, Dahlin AM, et al. High SMAD4 levels appear in microsatellite instability and hypermethylated colon cancers, and indicate a better prognosis. Int J Cancer 2012;131:779–88. [DOI] [PubMed] [Google Scholar]
- [9].Li S, Zhao B, Zhao H, et al. Silencing of long non-coding RNA SMAD5-AS1 reverses epithelial mesenchymal transition in nasopharyngeal carcinoma via microRNA-195-dependent inhibition of SMAD5. Front Oncol 2019;9:1246. [DOI] [PMC free article] [PubMed] [Google Scholar]
- [10].Chen Z, Lu X, Jia D, et al. Hepatic SMARCA4 predicts HCC recurrence and promotes tumour cell proliferation by regulating SMAD6 expression. Cell Death Dis 2018;9:59. [DOI] [PMC free article] [PubMed] [Google Scholar]
- [11].Stolfi C, Marafini I, De Simone V, et al. The dual role of Smad7 in the control of cancer growth and metastasis. Int J Mol Sci 2013;14:23774–90. [DOI] [PMC free article] [PubMed] [Google Scholar]
- [12].Thakur R, Laye JP, Lauss M, et al. Transcriptomic analysis reveals prognostic molecular signatures of stage I melanoma. Clin Cancer Res 2019;25:7424–35. [DOI] [PMC free article] [PubMed] [Google Scholar]
- [13].Li G, Xu W, Zhang L, et al. Development and validation of a CIMP-associated prognostic model for hepatocellular carcinoma. EBioMedicine 2019;47:128–41. [DOI] [PMC free article] [PubMed] [Google Scholar]
- [14].Tang Z, Li C, Kang B, et al. GEPIA: a web server for cancer and normal gene expression profiling and interactive analyses. Nucleic Acids Res 2017;45:W98–102. [DOI] [PMC free article] [PubMed] [Google Scholar]
- [15].Yu G, He QY. ReactomePA: an R/bioconductor package for reactome pathway analysis and visualization. Mol Biosyst 2016;12:477–9. [DOI] [PubMed] [Google Scholar]
- [16].Yu G, Wang LG, Han Y, et al. ClusterProfiler: an R package for comparing biological themes among gene clusters. OMICS 2012;16:284–7. [DOI] [PMC free article] [PubMed] [Google Scholar]
- [17].Yu G, Wang LG, Yan GR, et al. DOSE: an R/bioconductor package for disease ontology semantic and enrichment analysis. Bioinformatics 2015;31:608–9. [DOI] [PubMed] [Google Scholar]
- [18].Szklarczyk D, Franceschini A, Wyder S, et al. STRING v10: protein-protein interaction networks, integrated over the tree of life. Nucleic Acids Res 2015;43:D447–52. [DOI] [PMC free article] [PubMed] [Google Scholar]
- [19].Shannon P, Markiel A, Ozier O, et al. Cytoscape: a software environment for integrated models of biomolecular interaction networks. Genome Res 2003;13:2498–504. [DOI] [PMC free article] [PubMed] [Google Scholar]
- [20].Barrett T, Wilhite SE, Ledoux P, et al. NCBI GEO: archive for functional genomics data sets--update. Nucleic Acids Res 2013;41:D991–5. [DOI] [PMC free article] [PubMed] [Google Scholar]
- [21].Feng L, Wang J, Cao B, et al. Gene expression profiling in human lung development: an abundant resource for lung adenocarcinoma prognosis. PLoS One 2014;9:e105639. [DOI] [PMC free article] [PubMed] [Google Scholar]
- [22].Subramanian A, Tamayo P, Mootha VK, et al. Gene set enrichment analysis: a knowledge-based approach for interpreting genome-wide expression profiles. Proc Natl Acad Sci U S A 2005;102:15545–50. [DOI] [PMC free article] [PubMed] [Google Scholar]
- [23].Mootha VK, Lindgren CM, Eriksson KF, et al. PGC-1alpha-responsive genes involved in oxidative phosphorylation are coordinately downregulated in human diabetes. Nat Genet 2003;34:267–73. [DOI] [PubMed] [Google Scholar]
- [24].Torre LA, Siegel RL, Jemal A. Lung cancer statistics. Adv Exp Med Biol 2016;893:1–9. [DOI] [PubMed] [Google Scholar]
- [25].Klugman M, Xue X, Hosgood HD., 3rd Race/ethnicity and lung cancer survival in the United States: a meta-analysis. Cancer Causes Control 2019;30:1231–41. [DOI] [PubMed] [Google Scholar]
- [26].Siegel RL, Miller KD, Jemal A. Cancer statistics, 2017. CA Cancer J Clin 2017;67:7–30. [DOI] [PubMed] [Google Scholar]
- [27].Relli V, Trerotola M, Guerra E, et al. Distinct lung cancer subtypes associate to distinct drivers of tumor progression. Oncotarget 2018;9:35528–40. [DOI] [PMC free article] [PubMed] [Google Scholar]
- [28].Wang L, Ding Q, Zhao L, et al. Decreased BMP-7 and p-Smad1/5/8 expression, and increased levels of gremlin in hepatocellular carcinoma. Oncol Lett 2018;16:2113–8. [DOI] [PMC free article] [PubMed] [Google Scholar]
- [29].Qu F, Zheng J, Gan W, et al. MiR-199a-3p suppresses proliferation and invasion of prostate cancer cells by targeting Smad1. Oncotarget 2017;8:52465–73. [DOI] [PMC free article] [PubMed] [Google Scholar]
- [30].Gonzalez-Gonzalez A, Munoz-Muela E, Marchal JA, et al. Activating transcription factor 4 modulates TGFbeta-induced aggressiveness in triple-negative breast cancer via SMAD2/3/4 and mTORC2 signaling. Clin Cancer Res 2018;24:5697–709. [DOI] [PubMed] [Google Scholar]
- [31].Yang J, Wahdan-Alaswad R, Danielpour D. Critical role of SMAD2 in tumor suppression and transforming growth factor-beta-induced apoptosis of prostate epithelial cells. Cancer Res 2009;69:2185–90. [DOI] [PMC free article] [PubMed] [Google Scholar]
- [32].Hoot KE, Lighthall J, Han G, et al. Keratinocyte-specific SMAD2 ablation results in increased epithelial-mesenchymal transition during skin cancer formation and progression. J Clin Invest 2008;118:2722–32. [DOI] [PMC free article] [PubMed] [Google Scholar]
- [33].Chen Y, Xing P, Chen Y, et al. High p-SMAD2 expression in stromal fibroblasts predicts poor survival in patients with clinical stage I to IIIA non-small cell lung cancer. World J Surg Oncol 2014;12:328. [DOI] [PMC free article] [PubMed] [Google Scholar]
- [34].Samanta D, Gonzalez AL, Nagathihalli N, et al. Smoking attenuates transforming growth factor-beta-mediated tumor suppression function through downregulation of Smad3 in lung cancer. Cancer Prev Res (Phila) 2012;5:453–63. [DOI] [PMC free article] [PubMed] [Google Scholar]
- [35].Qian Z, Zhang Q, Hu Y, et al. Investigating the mechanism by which SMAD3 induces PAX6 transcription to promote the development of non-small cell lung cancer. Respir Res 2018;19:262. [DOI] [PMC free article] [PubMed] [Google Scholar]
- [36].Yan P, Klingbiel D, Saridaki Z, et al. Reduced expression of SMAD4 Is associated with poor survival in colon cancer. Clin Cancer Res 2016;22:3037–47. [DOI] [PubMed] [Google Scholar]
- [37].Yamada S, Fujii T, Shimoyama Y, et al. SMAD4 expression predicts local spread and treatment failure in resected pancreatic cancer. Pancreas 2015;44:660–4. [DOI] [PubMed] [Google Scholar]
- [38].Liu N, Qi D, Jiang J, et al. Expression pattern of p-SMAD2/SMAD4 as a predictor of survival in invasive breast ductal carcinoma. Oncol Lett 2020;19:1789–98. [DOI] [PMC free article] [PubMed] [Google Scholar]
- [39].Zhang Q, Gan H, Song W, et al. MicroRNA-145 promotes esophageal cancer cells proliferation and metastasis by targeting SMAD5. Scand J Gastroenterol 2018;53:769–76. [DOI] [PubMed] [Google Scholar]
- [40].Jin X, Nie E, Zhou X, et al. Fstl1 promotes glioma growth through the BMP4/SMAD1/5/8 signaling pathway. Cell Physiol Biochem 2017;44:1616–28. [DOI] [PubMed] [Google Scholar]
- [41].Jiao J, Zhang R, Li Z, et al. Nuclear Smad6 promotes gliomagenesis by negatively regulating PIAS3-mediated STAT3 inhibition. Nat Commun 2018;9:2504. [DOI] [PMC free article] [PubMed] [Google Scholar]
- [42].Zhang J, Zhang L, Cui H, et al. High expression levels of SMAD3 and SMAD7 at diagnosis predict poor prognosis in acute myeloid leukemia patients undergoing chemotherapy. Cancer Gene Ther 2019;26:119–27. [DOI] [PubMed] [Google Scholar]
- [43].Chiba T, Ishisaki A, Kyakumoto S, et al. Transforming growth factor-beta1 suppresses bone morphogenetic protein-2-induced mesenchymal-epithelial transition in HSC-4 human oral squamous cell carcinoma cells via SMAD1/5/9 pathway suppression. Oncol Rep 2017;37:713–20. [DOI] [PMC free article] [PubMed] [Google Scholar]
Associated Data
This section collects any data citations, data availability statements, or supplementary materials included in this article.