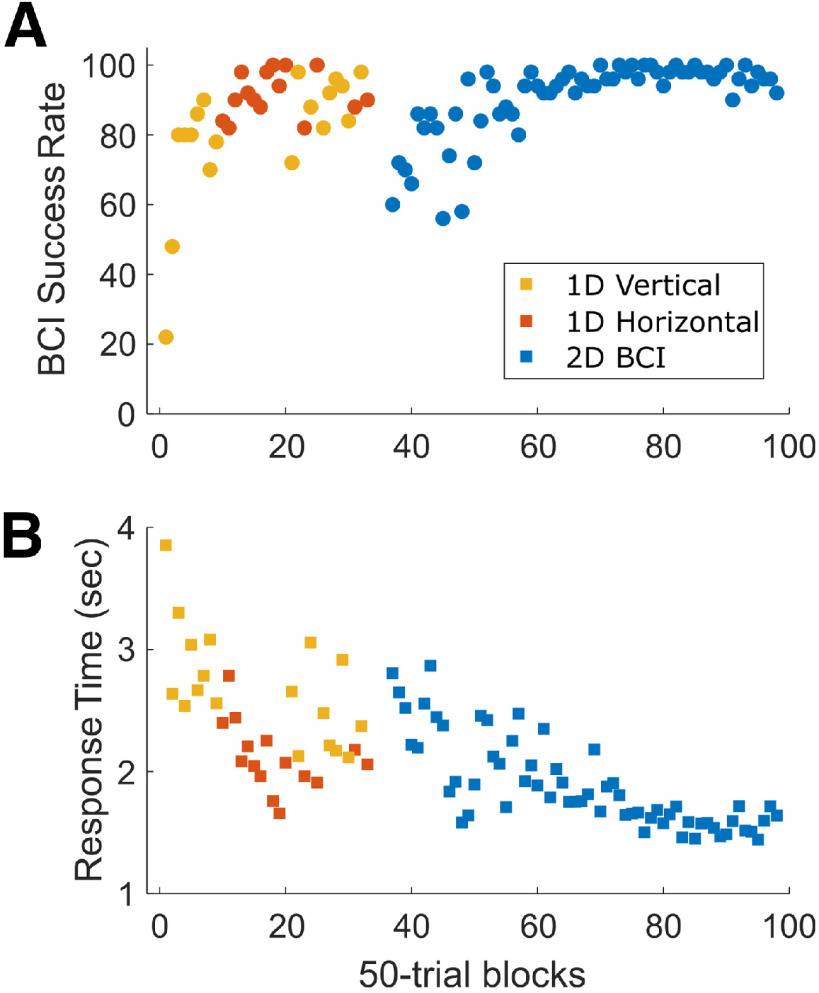
Figure 3.
BCI training. Success rates (A) and mean response times (B) are shown in sequential blocks of 50 successfully performed trials over 10 daily training sessions. As success rates increased, response times (from the appearance of the Go cue until the cursor had been in the target for 50 ms) decreased. The number of blocks of 50 successful trials varied from one training day to the next. Data from Monkey Q, assignment ii.

