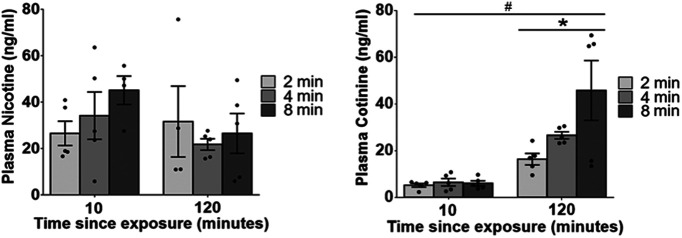
Figure 5.
Plasma concentrations for nicotine (left) and cotinine (right) at 10 or 120 min after termination of a 10-min total exposure session during which vapor was delivered for one of 2, 4, or 8 min. Data represented as mean ± standard error of the mean (SEM); #p < 0.0001 120- versus 10-min time point; *p < 0.05 dose trend.

