Figure 4.

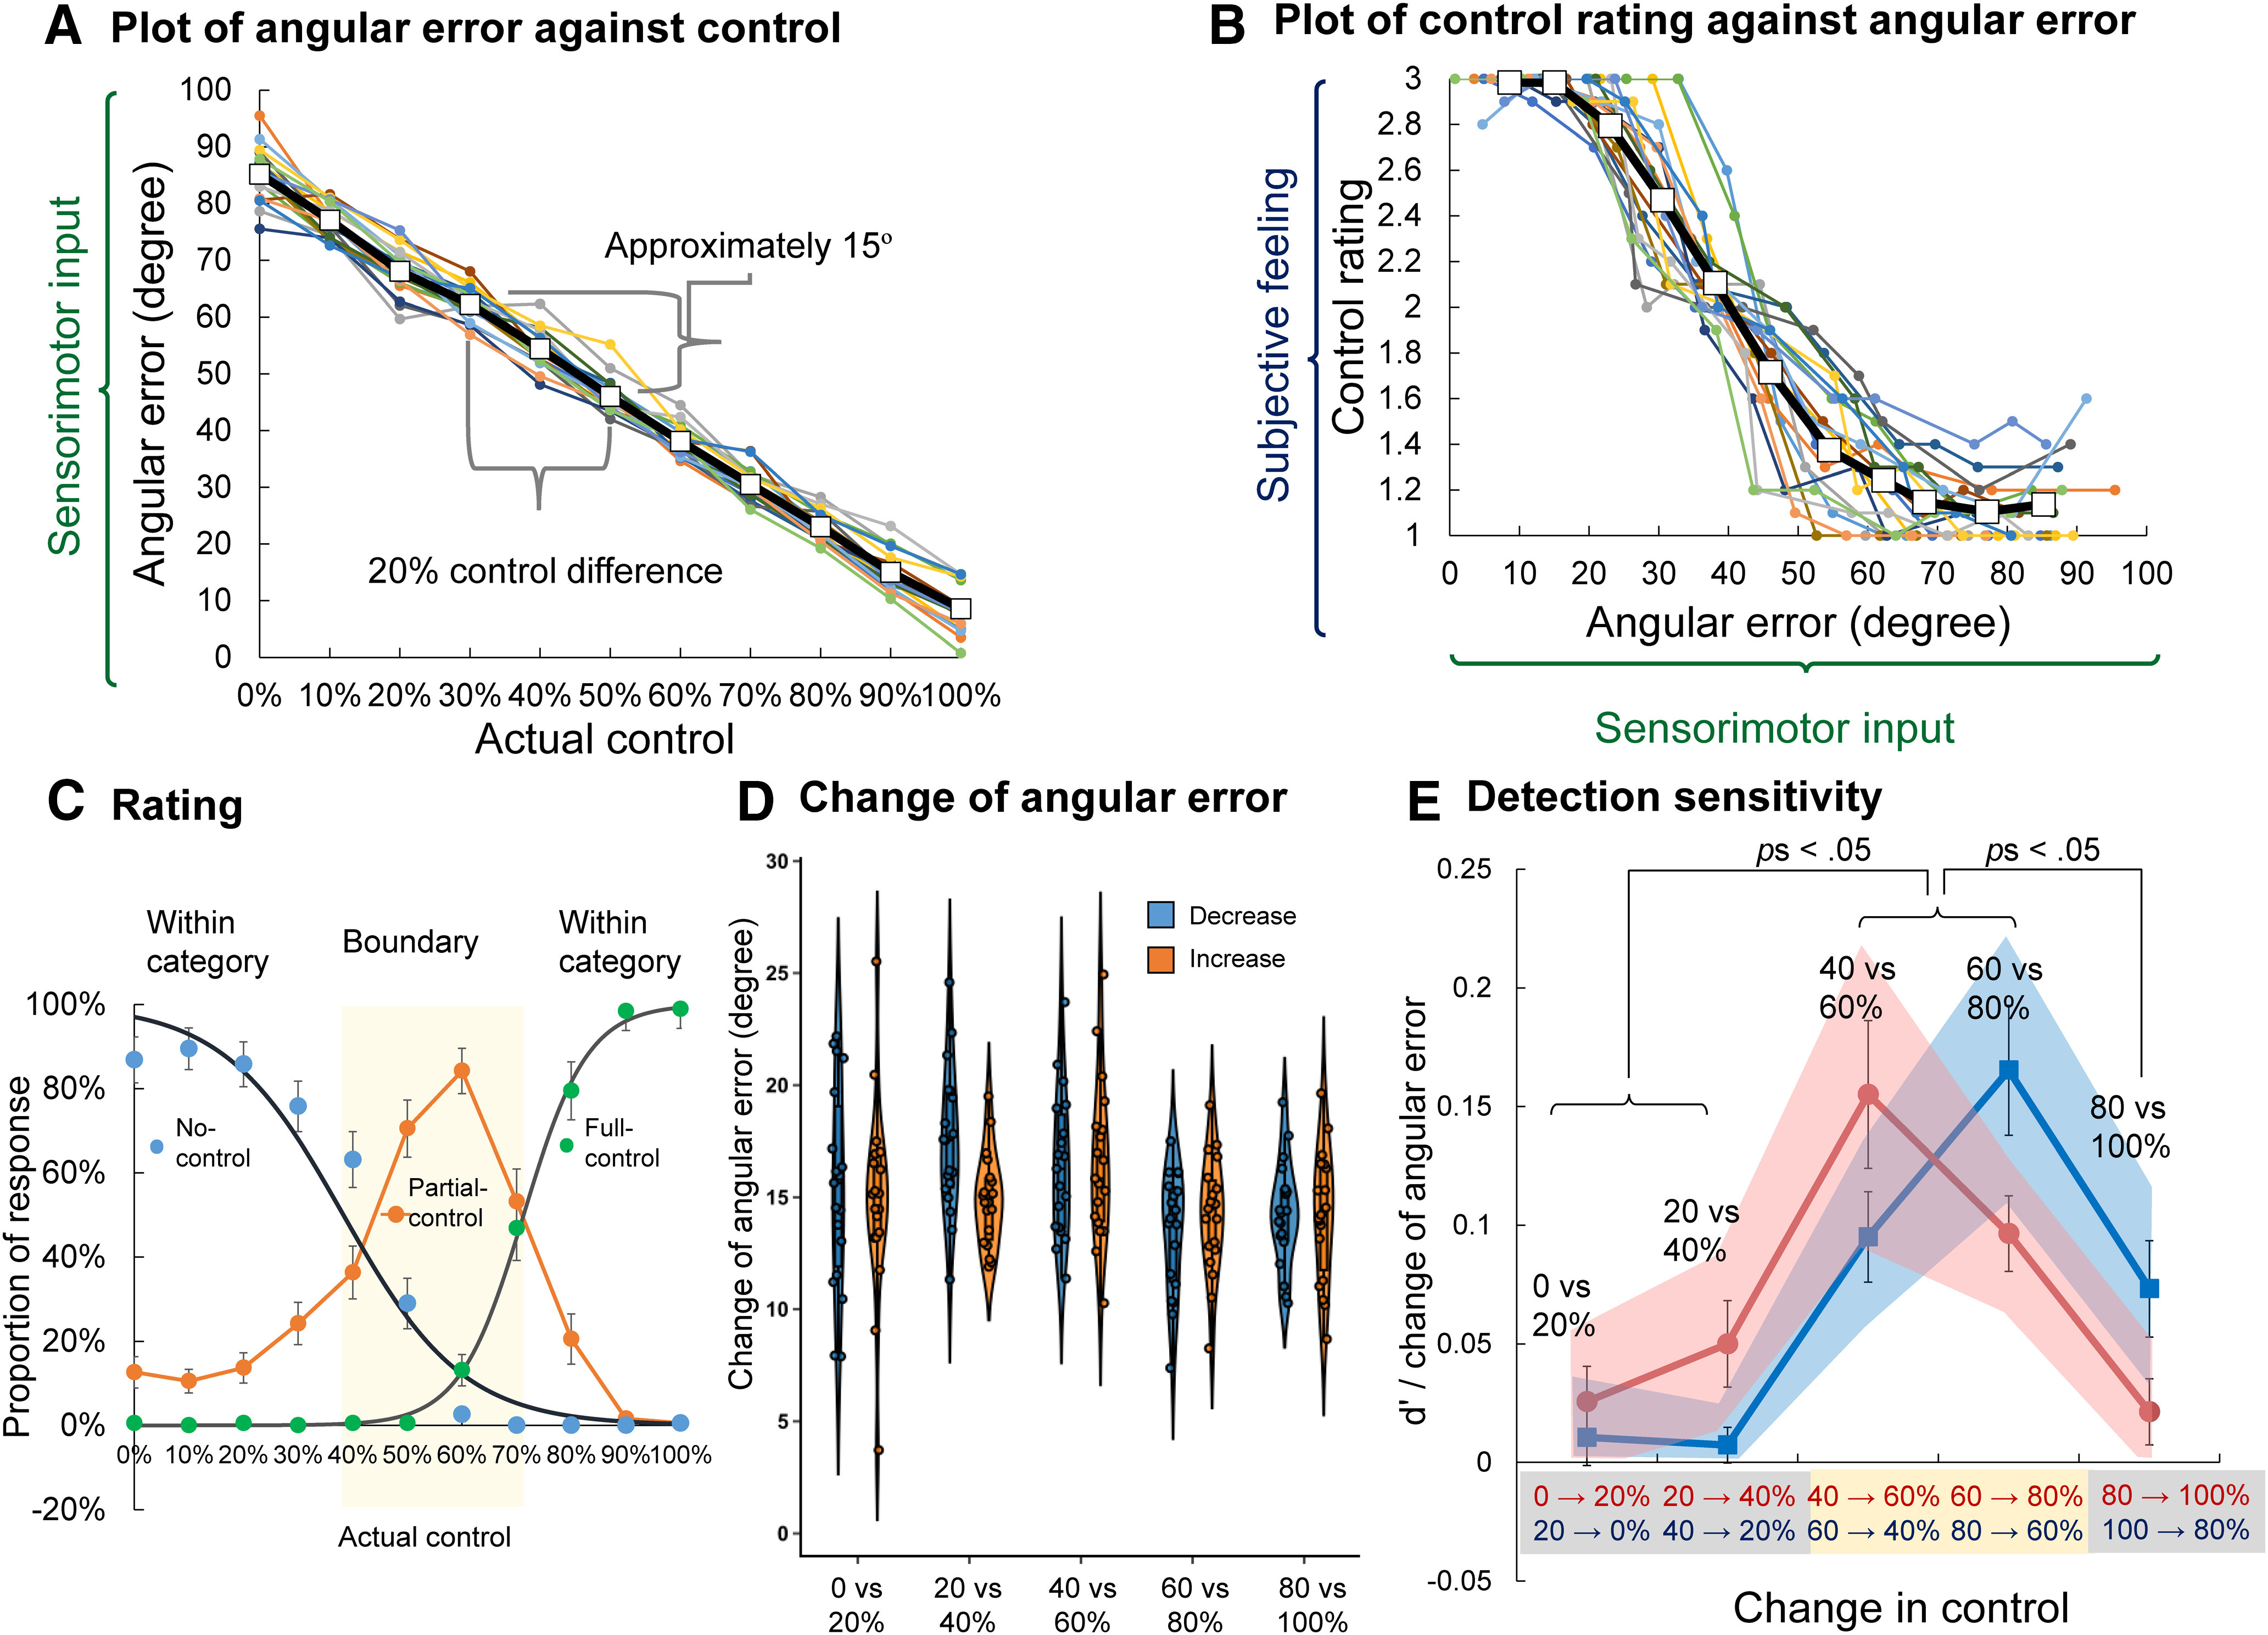
Results of Experiment 1. A, Individual and average plots of angular error against actual control. Colors represent individual results. Open squares and black lines represent averages. These plots indicate that angular error, as a sensorimotor input, is a linear function of the actual level of control. In addition, every 20% control difference corresponds to an angular error difference of ∼15°. B, Individual and average plots of control rating against angular error. Colors represent individual results. Open squares and black lines represent averages. These plots show that the subjective judgment of control is a logistic-like function of continuous sensorimotor input. C, Proportion of each rating response (no control, partial control, and full control). Black curves represent the logistic fitting results for the no-control and full-control responses. The yellow area indicates the range between the no-control and full-control PSEs. The left and right sides of the yellow rectangle indicate the no-control and full-control PSEs (50% threshold), respectively. Error bars represent standard errors. D, Change of angular error under each change condition (i.e., increase or decrease conditions). Under all conditions, the magnitude of control change was 20%. However, the actual change of angular error differed slightly between conditions. Because the physical change of control did not, as expected, remain constant between conditions, d′/ΔE was used (with ΔE representing the change in angular error), instead of raw d′, to exclude the influence of unbalanced physical changes between conditions in all statistical analyses. E, Sensitivity (d′/ΔE) calculated from the response of the control discrimination task. The squares and bold lines indicate averaged d′/ΔE under each condition. Shadows represent 95% confidence intervals. Error bars represent standard errors. Red asterisks represent significant post hoc pairwise differences.
