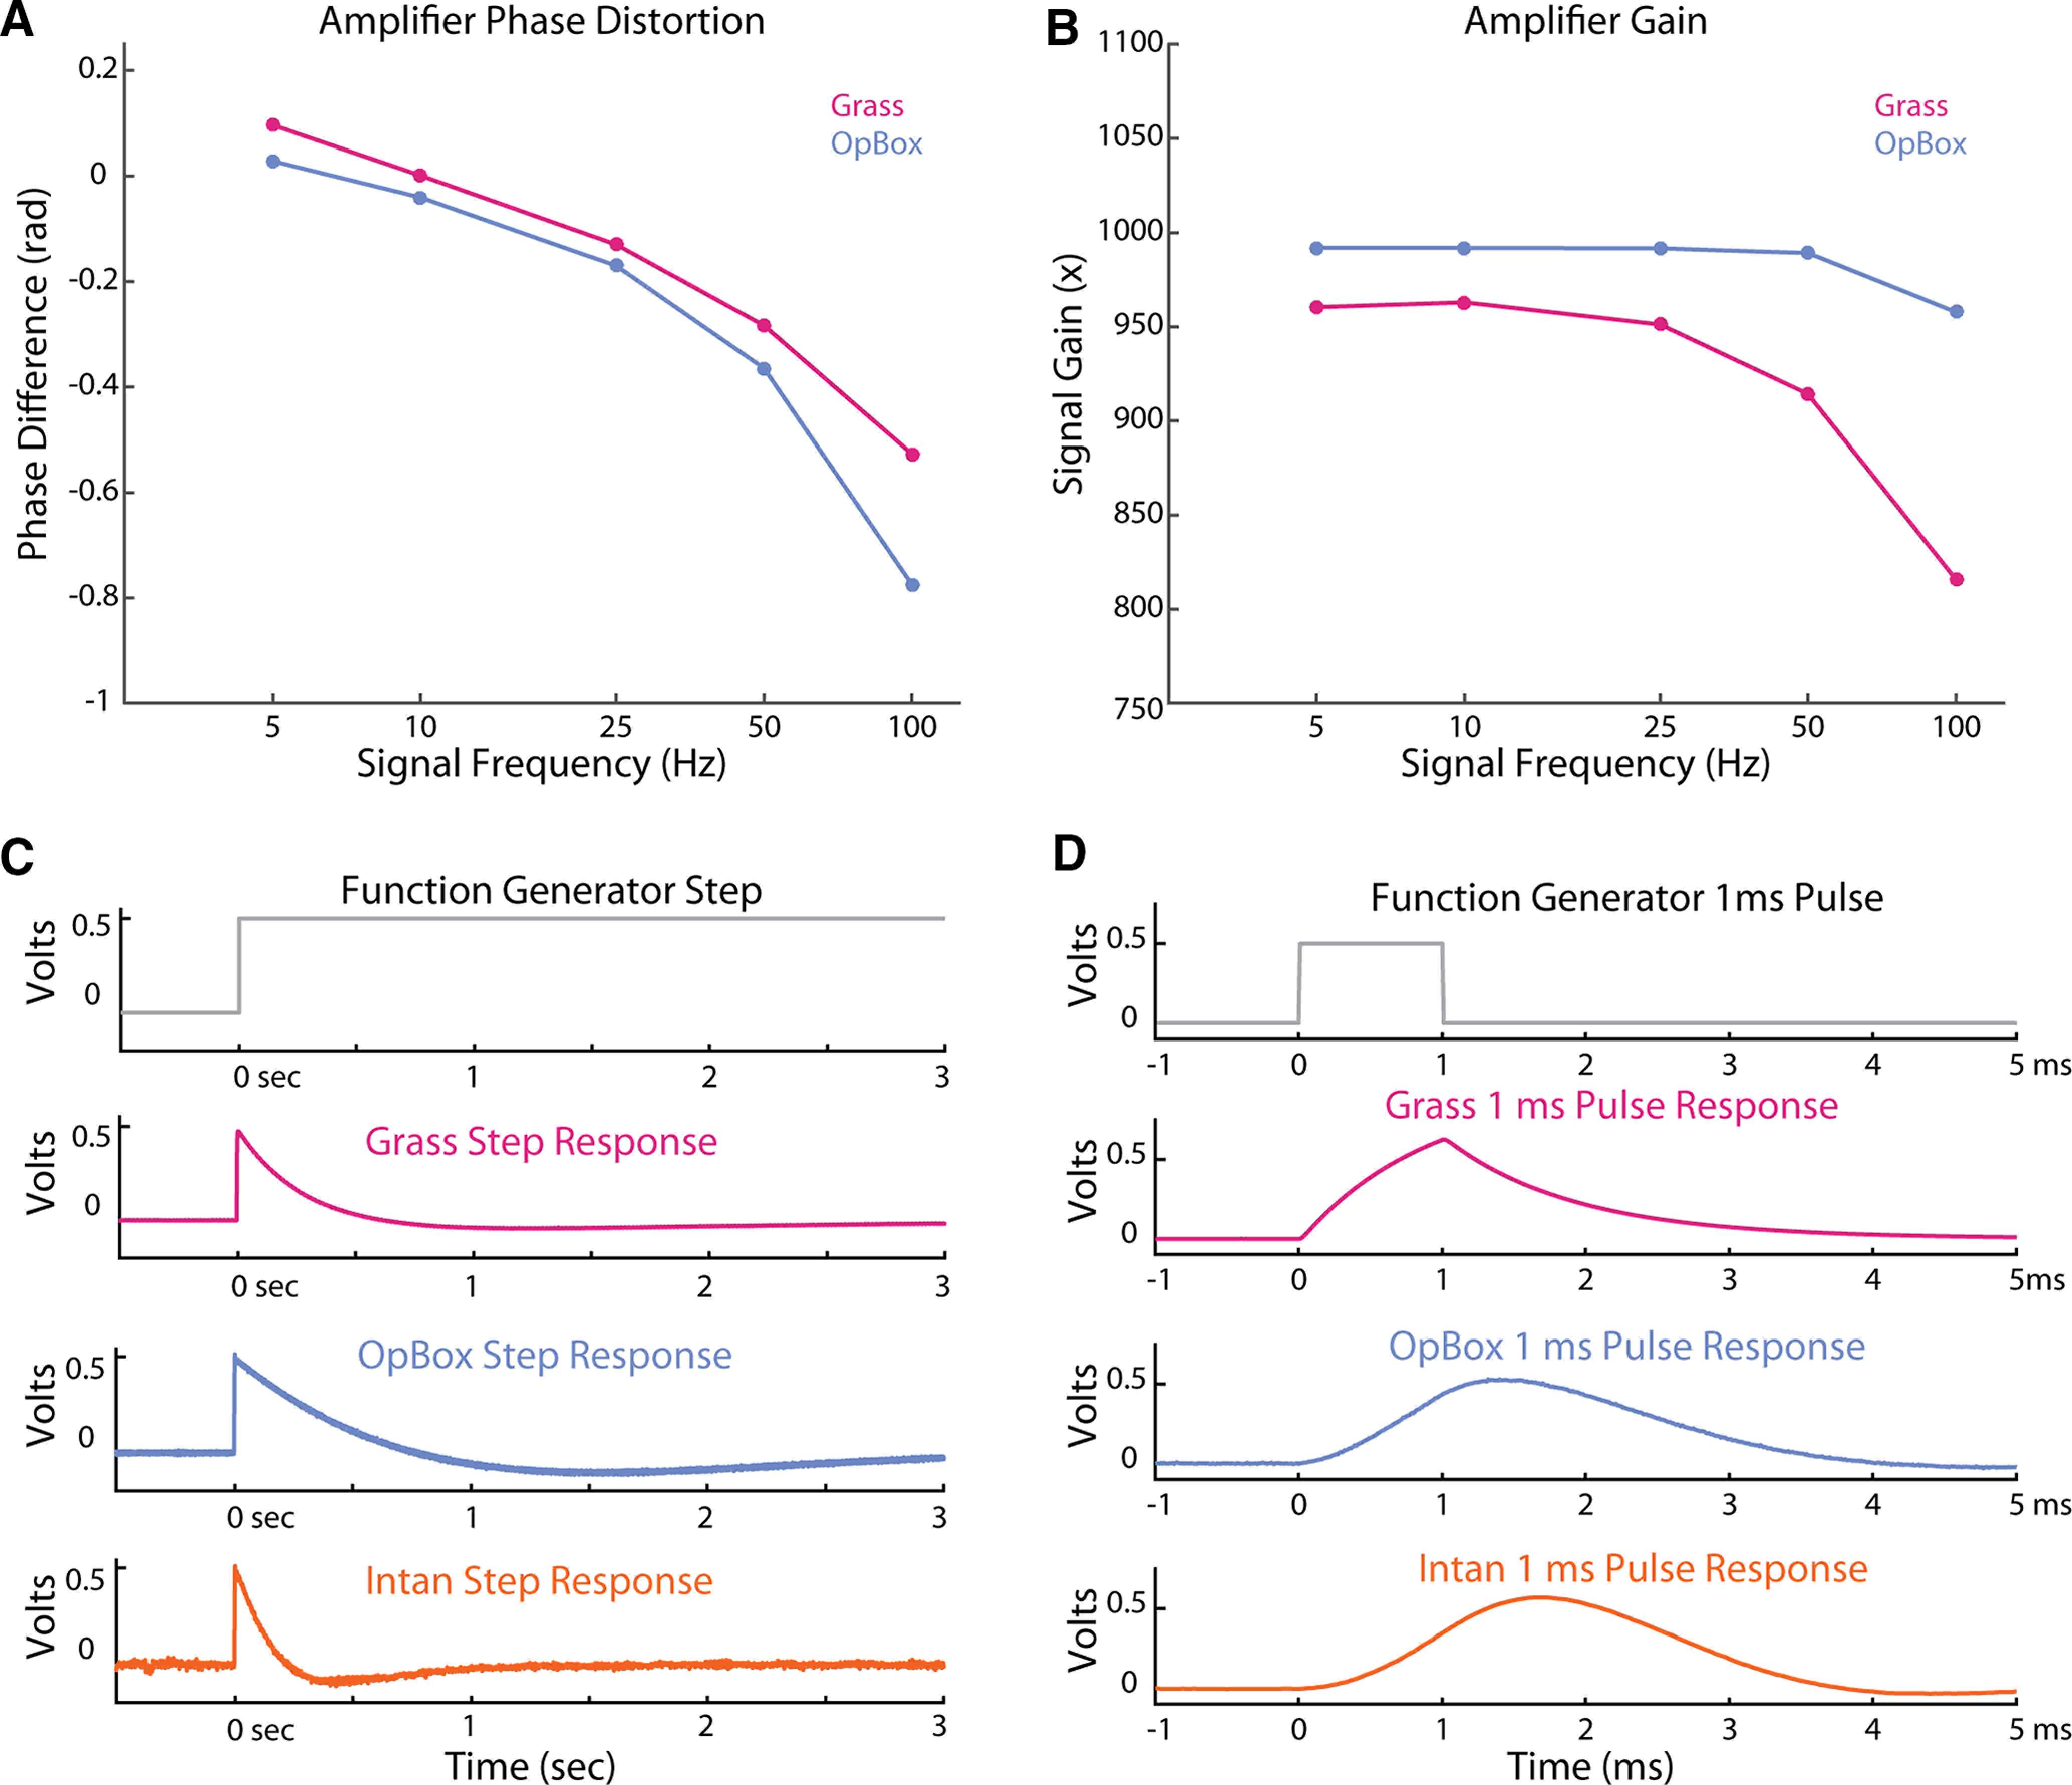
Figure 5.

High sample rate tests. OpBox and Grass amplifiers were sampled at 100 kHz via OpBox scripts in MATLAB, and the Intan amplifier was sampled at their max rate of 30 kHz using the Open Ephys GUI. A, Phase distortion from Grass and OpBox amplifiers at 5 different frequencies; 1-mV peak-to-peak sine wave signals at varying frequencies were split from a function generator and sent to one channel of the amplifier via a voltage divider as well as directly to the DAQ. Data from both inputs were sampled simultaneously at 100 kHz. Recordings were Hilbert transformed and the difference in phase angle was calculated for each frequency tested. B, Measured gain for Grass and OpBox amplifiers at each frequency. Using the same recordings, RMS values over the entire 10 s were calculated and the ratio of amplified signals versus direct to DAQ signals divided by 1000 (to match the voltage divider output) are reported for each frequency. C, Amplifier responses to a step response, a 10-s, 500-μV unipolar rectangular wave. A simulated version of the amplifier input is shown in the top plot. D, Amplifier responses to an approximate impulse response, a 1-ms, 500-μV unipolar pulse. A simulated version of the amplifier input is shown in the top plot.
