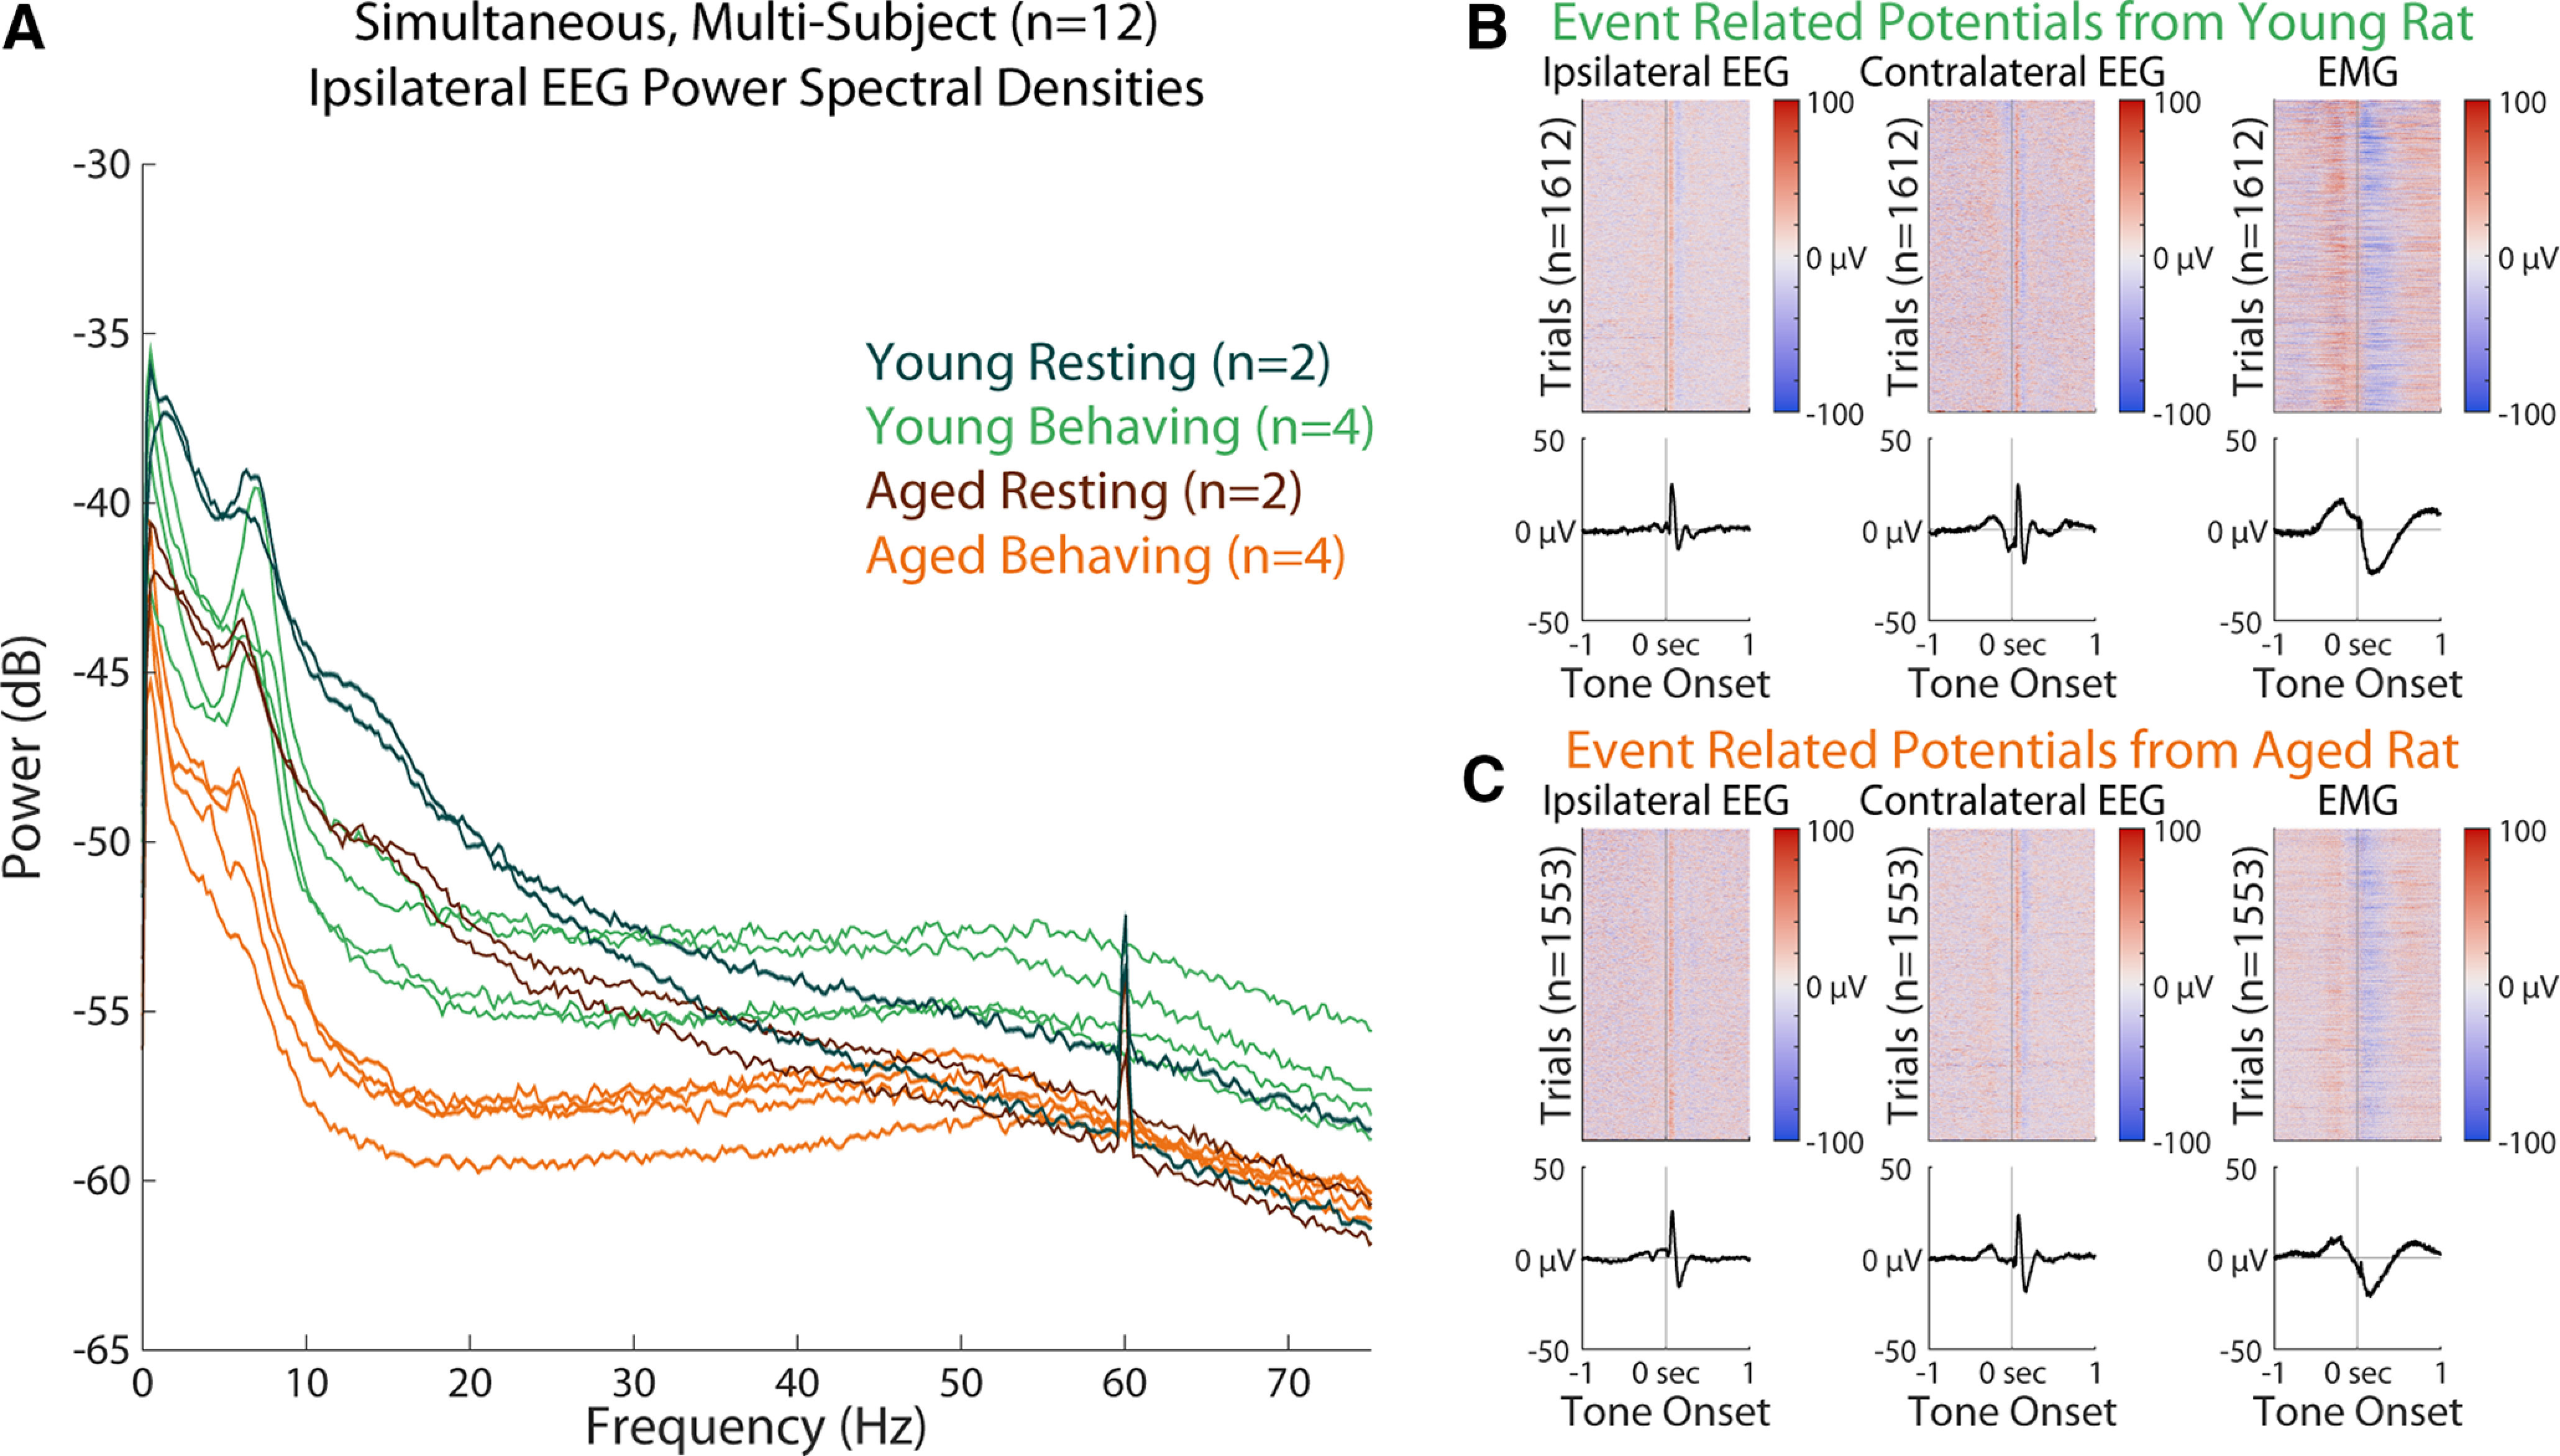
Figure 6.

Multisubject session demonstrating the ability to record electrophysiology (EEG and EMG) data from 12 subjects simultaneously. A, Combined plot of all 12 subjects’ ipsilateral EEG power spectrums. Each trace represents the mean power spectral density from one subject over 1 h of EEG recording. Traces are color coded by cohort, determined by age and whether subjects are performing a Go/No-go task or are resting. B, C, Evoked potential data from a young and aged subject, respectively, from the same session, demonstrating the consistent ability to synchronize EEG recordings with behavioral event triggers. Evoked responses shown were collected over the entire 4-h behavioral session. Each column represents a channel of EEG (ipsilateral or contralateral) or EMG. Top plots represent analog rasters for each trial, bottom plots represent the channel means, plotted with shaded SEM, although the high trial counts have reduced these intervals too much to visualize. Stimuli presentations were 1 s long and self-initiated by a nosepoke at least 100 ms in duration. Depending on task criteria, tones were 3.5, 6.5, or 12 kHz in frequency, at ∼55 dB. Time 0 s indicates tone onset, with preceding nosepoke registration at −0.1 s.
