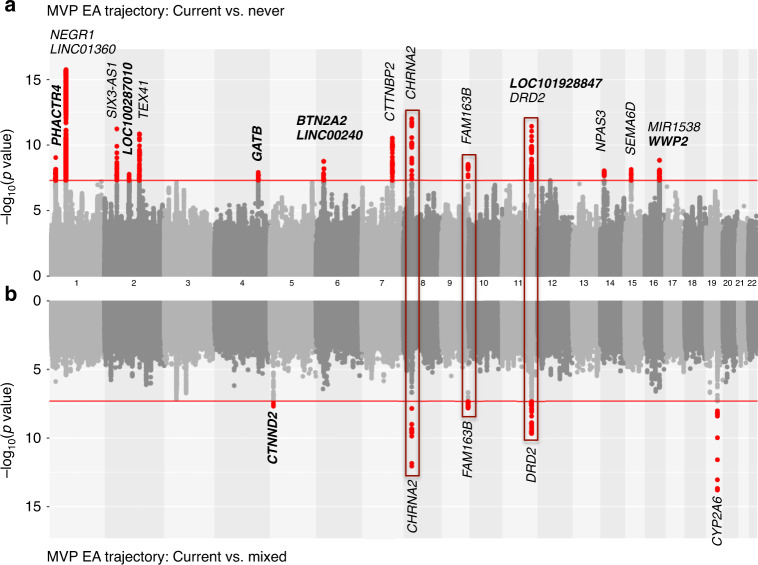
Fig. 2. Genome-wide association study results for smoking trajectory contrasts.
Mirror Manhattan plots for smoking trajectory contrast I (current vs. never (a)) and contrast II (current vs. mixed (b)) in European American samples in the Million Veteran Program. Genome-wide significant loci are highlighted in red and mapped to genes by the nearest location. Genes have not been previously reported to be associated with smoking phenotypes in other studies are marked in bold. Three loci shared by contrast I (current vs. never) and contrast II (current vs. mixed) are highlighted in red boxes.

