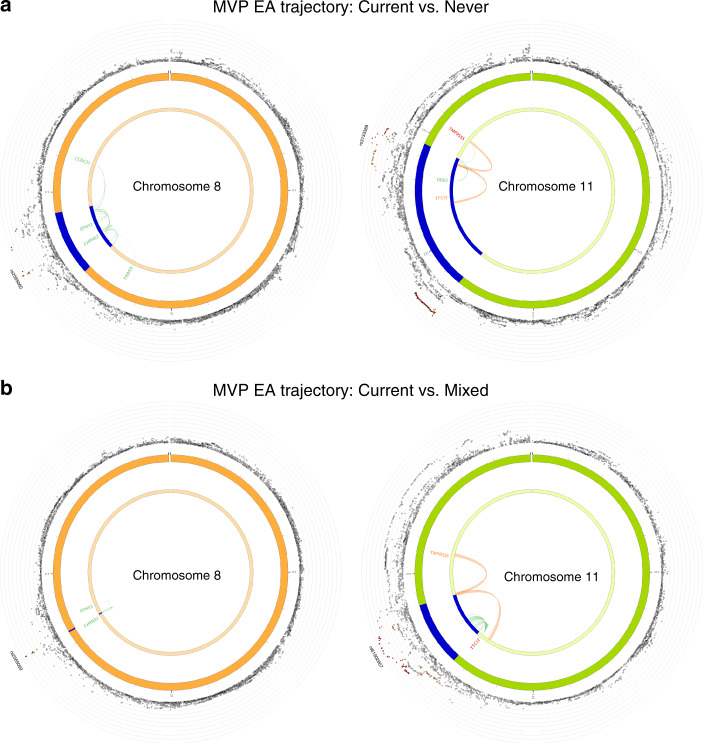
Fig. 3. Gene prioritization for smoking trajectory contrasts.
Functional mapping and annotation (FUMA) gene prioritization for smoking trajectory contrast I (current vs. never (a)) and contrast II (current vs. mixed (b)) in European American samples in the Million Veteran Program. The outer layer shows chromosomal Manhattan plots. Region in blue shows genome-wide significant locus. Genes mapped by chromatin interactions and eQTLs are colored in orange and green, respectively. Genes mapped by both chromatin interactions and eQTLs are colored in red.

