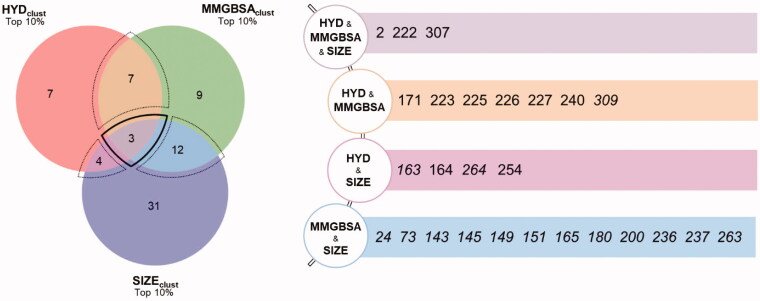
Figure 2.
The outcome of the HT-SuMD based fragments screening after consensus scoring of clusters is schematically represented through a Venn diagram, in which the number of non-redundant fragments identified is reported. A bold dashed line contains the molecules showing the greatest convergence of the three computational descriptors, while the thin dashed line delimits the regions of partial computational observables convergence. The areas are proportional to the number of clusters belonging to the region while the number of ligands is not necessarily proportional to the area (i.e. a fragment may be represented by multiple clusters). The ID of the different fragments prioritised by the in silico screening is reported on the right.

