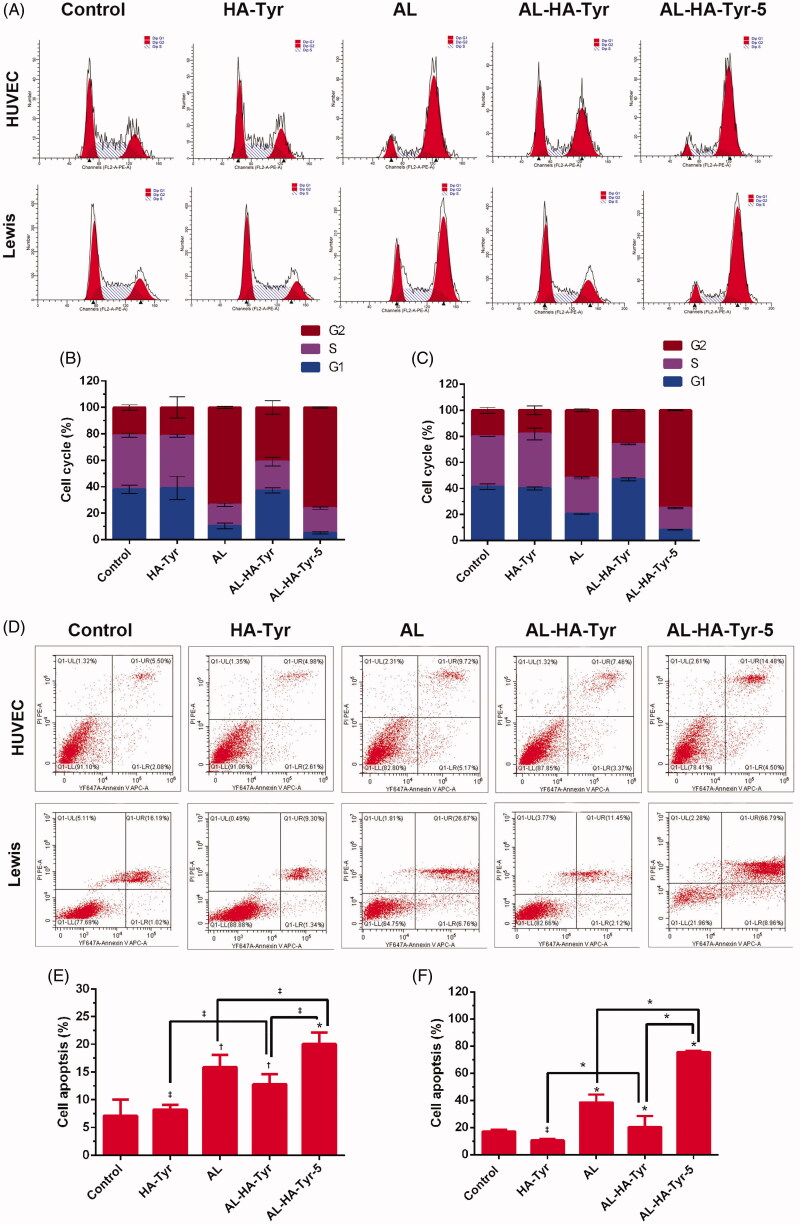
Figure 4.
Analysis cell-cycle distribution and cell apoptosis of HUVECs and Lewis lung cancer cells. (A) Cell-cycle distribution and (D) cell apoptosis after incubation with NS, HA–Tyr, AL, AL–HA–Tyr, and AL–HA–Tyr-5; (B, C) quantitative results of cells in G1, S, and G2 phase; (E, F) percentage of apoptosis cells in various groups. Data are shown as the means ± SD (n = 6). *p<.01, †p<.05, and ‡p>.05. LL, LR, and UR represent living cells, early apoptotic cells, and late apoptotic cells or dead cells, respectively.

