. 2020 Oct 1;9:e57858. doi: 10.7554/eLife.57858

Figure 5. USF1 and USF2 synergistically regulate HOXA9 expression in MLLr leukemia.

(A) Flow diagram of dropout CRISPR screening procedure. (B) Gene ranking of all transcription factors from dropout screening was illustrated. The enrichment score of seven sgRNAs against each transcription factor was combined by the MAGeCK algorithm. (C) Q-PCR was conducted to monitor HOXA9 expression upon CRISPR targeting on its promoter. (D) Competitive proliferation assay was conducted by infecting SEMCas9 cells with Lentiviral-mCherry-sgRNAs against HOXA9 promoter at about 50% efficiency. The mCherry% was quantified every three days by flow cytometry to evaluate the growth disadvantage. (E) Competitive proliferation assay was conducted by infecting SEMCas9 cells with Lentiviral-mCherry-sgRNAs against luciferase (sgLuc) and USF2 (sgUSF2#2, 2#3 and 2#5) at about 50% efficiency. The mCherry% was quantified every 3 days by flow cytometry to evaluate the growth disadvantage. (F) Rescued competitive proliferation assay was conducted by infecting SEM cells overexpressing ectopic Hoxa9 with Lentiviral-mCherry-sgRNAs against luciferase (sgLuc) and USF2 (sgUSF2#2, 2#3 and 2#5) at about 50% efficiency. The mCherry% was quantified every 3 days by flow cytometry to evaluate the growth disadvantage. (G) Q-PCR analysis was conducted on the sgUSF2, sgUSF1 and sgUSF1/2-targeted SEM cells to monitor the reduction of HOXA9. Data shown are means ± SEM from three independent experiments. **p<0.01, two-tailed Student’s t test. (H) Competitive proliferation assay was conducted by infecting SEMCas9 cells with Lentiviral-mCherry-sgLuc, sgUSF1, sgUSF2, and sgUSF1/2 (DKO) at about 50% efficiency. The mCherry% was quantified at days 3, 7, 11, 15, 19, and 23 by flow cytometry to evaluate the growth disadvantage. A guide RNA targeting the survival essential gene RPS19 was included as a positive control for Cas9 activity. Guide RNAs targeting Luciferase gene (sgLuc) and the human ROSA26 gene (sgROSA26) were included as a negative control. (I) Q-PCR analysis was conducted on the sgUSF2, sgUSF1 and sgUSF1/2 targeted OCI-AML2 cells to monitor the reduction of HOXA9. Data shown are means ± SEM from three independent experiments. *p<0.05, **p<0.01, two-tailed Student’s t test. (J) Competitive proliferation assay was conducted by infecting OCI-AML2Cas9 cells with Lentiviral-mCherry-sgLuc, sgUSF1, sgUSF2, and sgUSF1/2 (DKO) at about 50% efficiency. The mCherry% was quantified at days 3, 7, 11, 15, 19, and 23 by flow cytometry to evaluate the growth disadvantage. A guide RNA targeting the survival essential gene RPS19 was included as a positive control for Cas9 activity. Guide RNAs targeting Luciferase gene (sgLuc) and the human ROSA26 gene (sgROSA26) were included as negative controls.

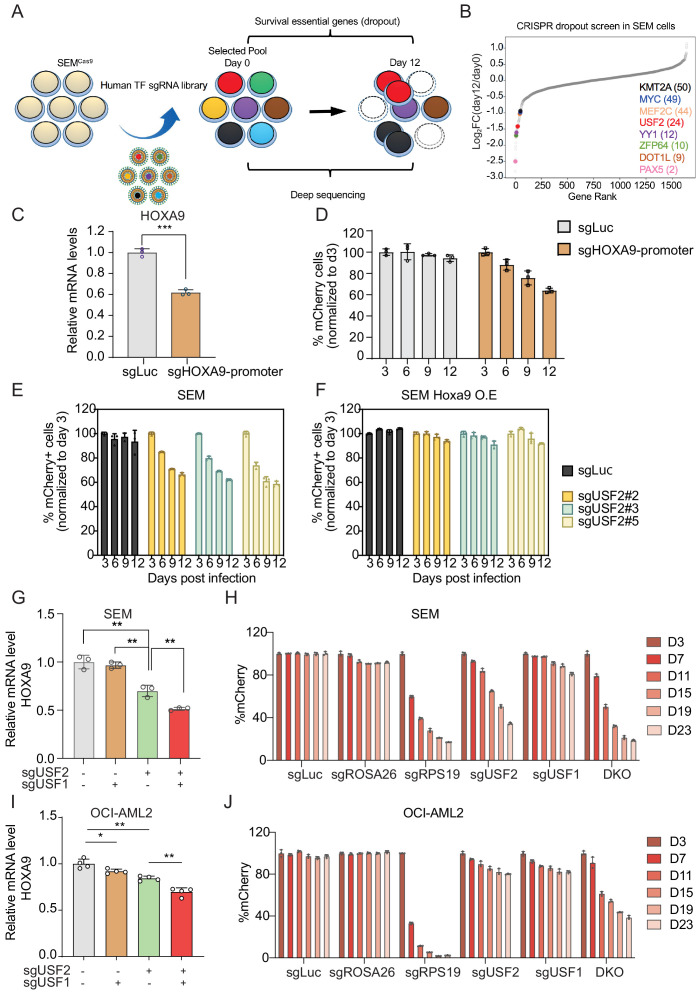
Figure 5.

Figure 5—figure supplement 1. USF2 depletion in MLLr leukemia cells.

Figure 5—figure supplement 1.

(A) Flow cytometry analysis was performed on the HOXA9P2A-mCherry SEM cells targeted with lentiviral Cas9 and sgRNAs against USF1, USF2, and USF1/2 (DKO). (B) Q-PCR was performed to validate the transcriptional regulation of HOXA9 upon USF2 targeting by two sgRNAs (sgUSF2#2 and sgUSF2#3) in OCI-AML2 cells. Immunoblotting confirmed the complete depletion of USF2. (C) Q-PCR was performed to validate the transcriptional regulation of HOXA9 upon USF2 targeting by two sgRNAs (sgUSF2#2 and sgUSF2#3) in NOMO-1 cells. Immunoblotting confirmed the complete depletion of USF2. (D) Immunoblotting confirmed the complete depletion of USF1 in SEM cells upon USF1 targeting by a sgRNA. (E) Immunoblotting confirmed the complete depletion of USF1 in OCI-AML2 cells upon USF1 targeting by a sgRNA. (F) Immunoblotting confirmed the complete depletion of USF2 in MOLM13 cells USF2 targeting by two sgRNAs (sgUSF2#2 and sgUSF2#3). (G) Competitive proliferation assay was conducted by infecting MOLM13Cas9 cells with Lentiviral-mCherry-sgRNAs against luciferase (sgLuc) and USF2 (sgUSF2#2, 2#3 and 2#5) at about 50% efficiency. The mCherry% was quantified at days 0, 3, 7, 11, 15, 19, and 23 by flow cytometry to evaluate the growth disadvantage. A guide RNA targeting the survival essential gene RPS19 was included as a positive control for Cas9 activity. Guide RNAs targeting Luciferase gene (sgLuc) and the human ROSA26 gene (sgROSA26) were included as negative controls.
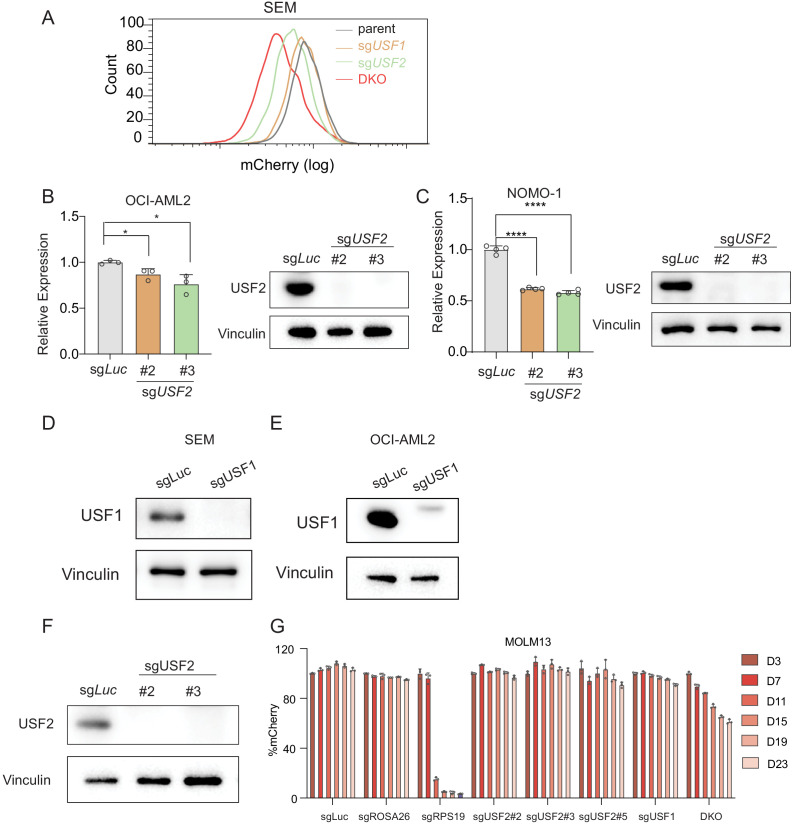
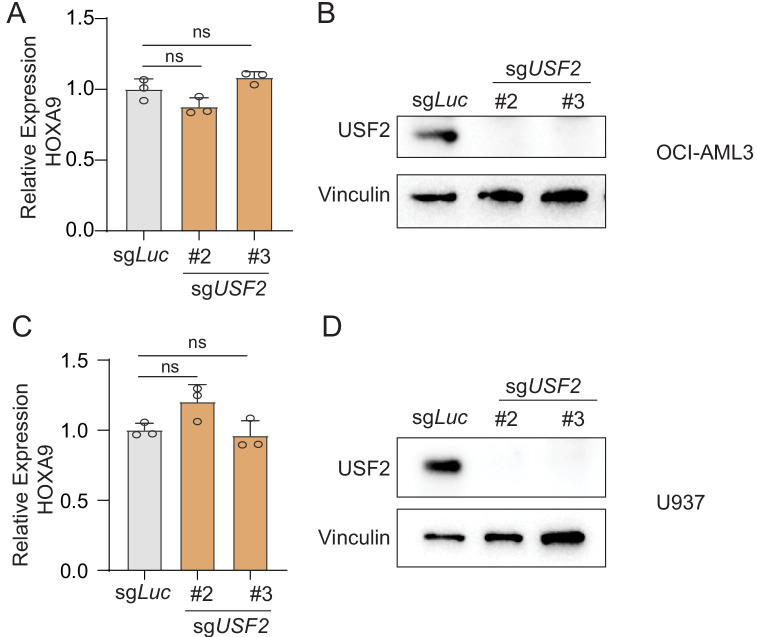
Figure 5—figure supplement 2. USF2 depletion in non-MLLr leukemia cells.

Figure 5—figure supplement 2.

(A) Q-PCR was performed to validate the transcriptional impact of HOXA9 upon USF2 targeting by two sgRNAs (sgUSF2#2 and sgUSF2#3) in OCI-AML3 cells. Immunoblotting confirmed the complete depletion of USF2. (B) Immunoblotting confirmed the complete depletion of USF2 in OCI-AML3 cells upon USF2 targeting by a sgRNA. (C) Q-PCR was performed to validate the transcriptional impact of HOXA9 upon USF2 targeting by two sgRNAs (sgUSF2#2 and sgUSF2#3) in U937 cells. Immunoblotting confirmed the complete depletion of USF2. (D) Immunoblotting confirmed the complete depletion of USF2 in U937 cells upon USF2 targeting by a sgRNA.
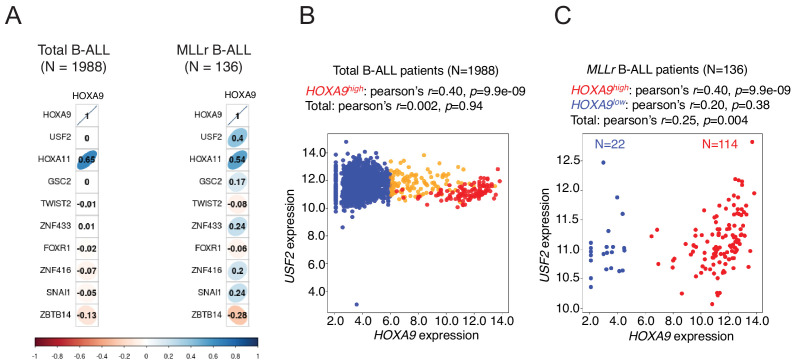
Figure 5—figure supplement 3. Transcriptional correlation between USF2 and HOXA9 in patient cohorts.

Figure 5—figure supplement 3.

(A) Pearson’s correlation of transcriptional levels of HOXA9 and top 10 positive regulators identified from TF screen in a cohort of 1988 B-ALL patients (Gu et al., 2019). (B) Pearson’s correlation of transcriptional levels of HOXA9 and USF2 in a cohort of 1988 B-ALL patients (Gu et al., 2019). (C) Pearson’s correlation of transcriptional levels of HOXA9 and USF2 in a cohort of 136 MLLr B-ALL patients (Gu et al., 2019).