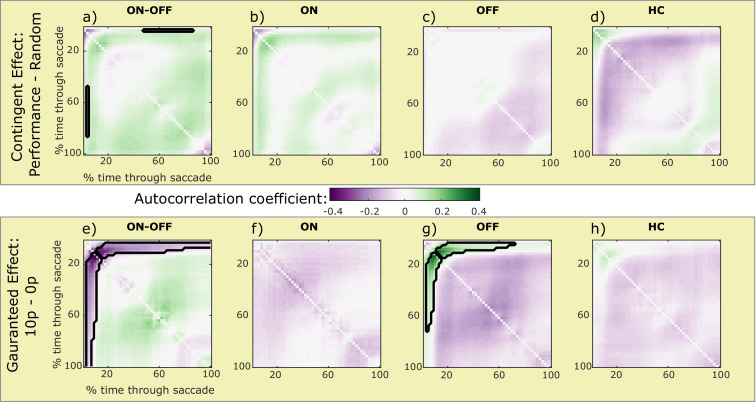
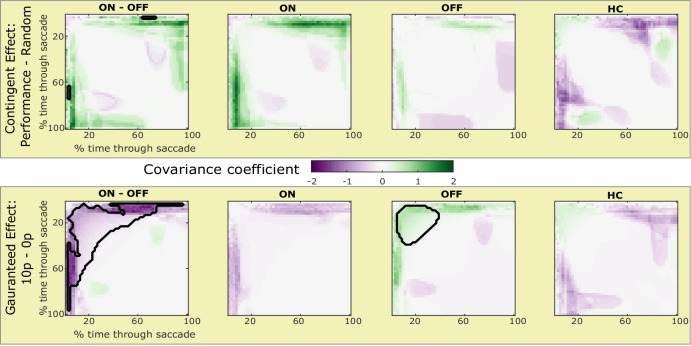
Figure 4. Motivational effects on eye-position autocorrelation within saccades.
Each image shows the effect of reward on mean correlation coefficient between the eye-position at one (interpolated) time-point within a saccade with all other time-points in that same saccade. As noise accumulates during the movements, the correlations increase over the time-points, while reductions in correlation can suggest negative feedback during movements. The top row shows the effect of contingent rewards (Performance – Random) on the (Fisher transformed) autocorrelation coefficients, and the bottom row shows the effect of guaranteed rewards (10 p – 0 p). Green areas mean that motivation increased correlation, while purple areas reflect a decrease, and clusters significantly different from zero are outlined in black (cluster permutation testing, p<0.05). When examining the dopaminergic effects (a and e: PD ON – OFF), a significant cluster was found, such that patients differed in their correlations early in the saccade when rewards were guaranteed (e). This was due to guaranteed rewards increasing early correlation only for PD OFF (g). The time of this increase matches the time of increased acceleration shown in Figure 3d. There was also a small cluster of significant difference between PD ON and OFF for contingent rewards (a), but there were no clusters within ON (b) or OFF (c) separately. HC had no clusters of significant differences (d and h). Source data are available in Figure 4—source data 1. Figure 4—source data 2. Individual data for autocorrelation. Figure 4—figure supplement 1. Motivational effects on saccade time-time covariance within saccades.


