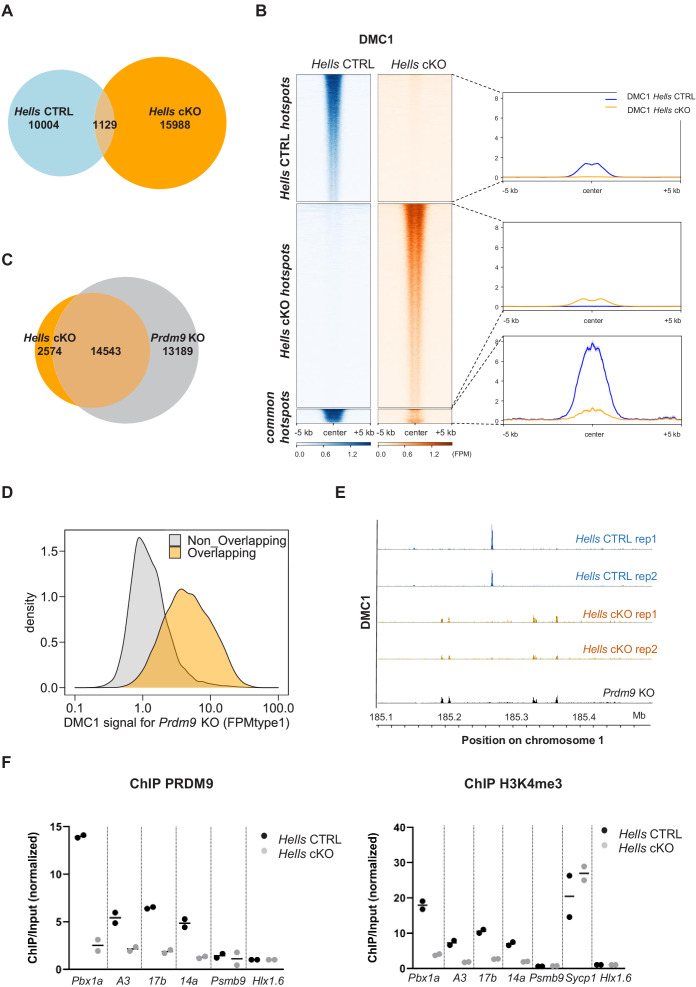
Figure 3. HELLS is required for the formation of meiotic DSBs at sites of PRDM9-dependent DSB formation; DSBs are directed at default sites in the absence of HELLS.
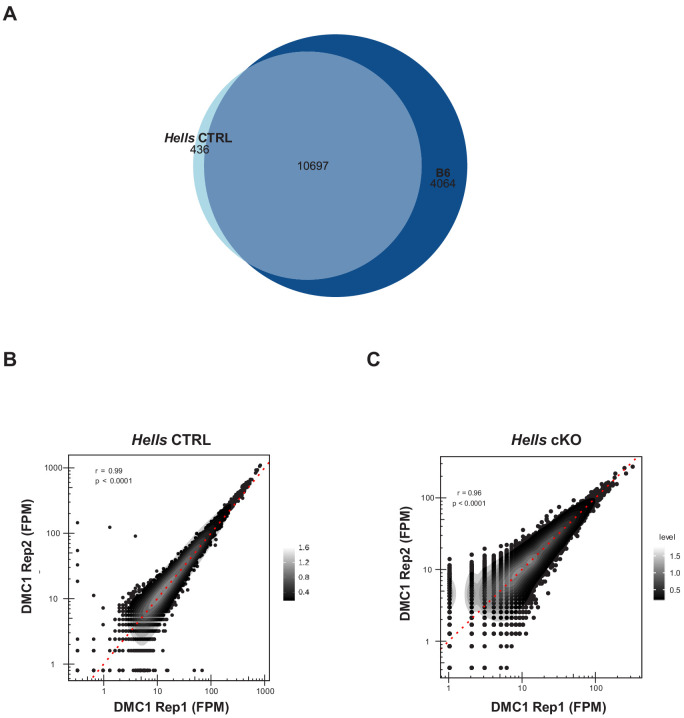
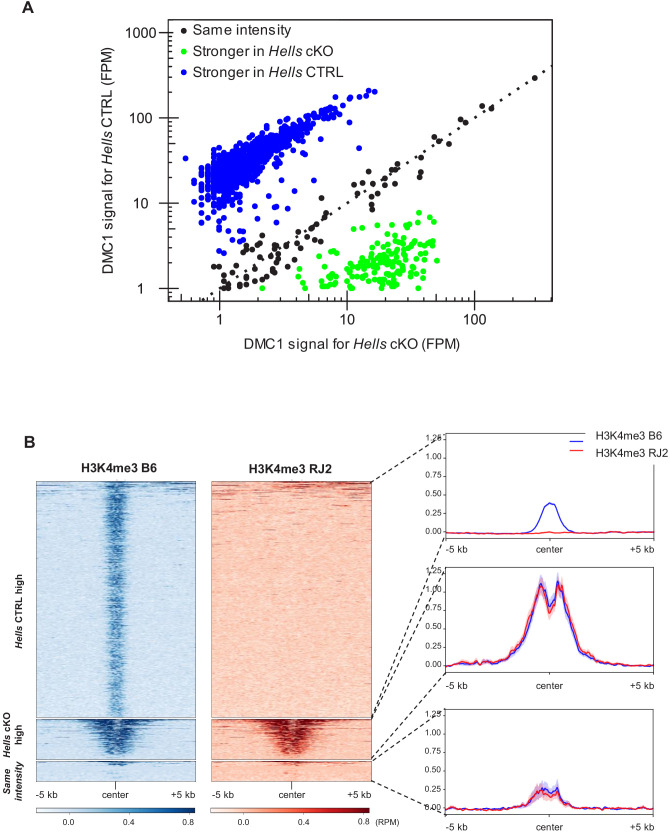
(A) Limited overlapping between DSB hotspots from Hells CTRL and Hells cKO testis samples. Only hotspot centers (DMC1-SSDS peaks) that overlapped within a 400bp-window were considered as common. The others were considered as Hells CTRL- or Hells cKO-specific hotspots. Controls are shown in Figure 3—figure supplement 1. (B) Distribution of the DMC1-SSDS signal from Hells CTRL and Hells cKO testis samples around Hells CTRL, Hells cKO and common hotspots (as defined in (A)). The heatmaps show the DMC1-SSDS normalized fragments per million, calculated in a −5 kb to +5 kb window around hotspot centers and averaged within 10bp-bins. For the Hells CTRL - or Hells cKO-specific hotspots, the sites on the heatmaps were ranked by decreasing DMC1 intensity (from top to bottom) in the genotype where the peaks were detected. For the common hotspots, the sites were ranked by decreasing DMC1 intensity (from top to bottom) in Hells CTRL mice. The averaged profiles represent the mean DMC1-SSDS signal for each group. The analysis of common hotspots is shown in Figure 3—figure supplement 2. (C) Wide overlapping of DSB hotspots from Hells cKO and Prdm9 KO testis samples. Hotspot (DMC1-SSDS peaks) centers that overlapped within a 400bp-window were considered as common. The others were considered to be Hells cKO- or Prdm9 KO-specific hotspots. Prdm9 KO data were from GSE99921 (Brick et al., 2012). (D) The DMC1-SSDS signal in Prdm9 KO testis samples is either Prdm9 KO-specific (i.e. not overlapping) or overlapping with Hells cKO-specific hotspots (as defined in (C)). Density of hotspot number is plotted as a function of the DMC1 signal in Prdm9 KO mice, expressed as FPMtype1 (type1-single-strand DNA fragments Per Million of mapped reads, see Materials and methods and Khil et al., 2012 for details). (E) DSB maps for Hells CTRL (blue) and Hells cKO (orange) testis samples (this study, two replicates for each genotype) and Prdm9 KO testis samples (black, GSE99921; Brick et al., 2012) at a representative region of chromosome 1 (185.1Mb-185.5Mb). (F) Enrichment of PRDM9 and H3K4me3 is reduced at hotspots in Hells cKO compared with Hells CTRL samples. PRDM9 and H3K4me3 ChIP/Input ratios were calculated at several B6 (PRDM9Dom2)-specific hotspots (Pbx1a, 14a, A3, 17b), at the Sycp1 promoter (only for H3K4me3), and at two control regions that contain PRDM9Cst-specific hotspots (Psmb9.8 and Hlx1.6). All ratios were normalized to the ratios at Hlx1.6. At the four B6-specific hotspots, the difference between Hells cKO and Hells CTRL was statistically significant (two-tailed Mann-Whitney, p=0.0002). Data are available in Figure 3—source data 1.


