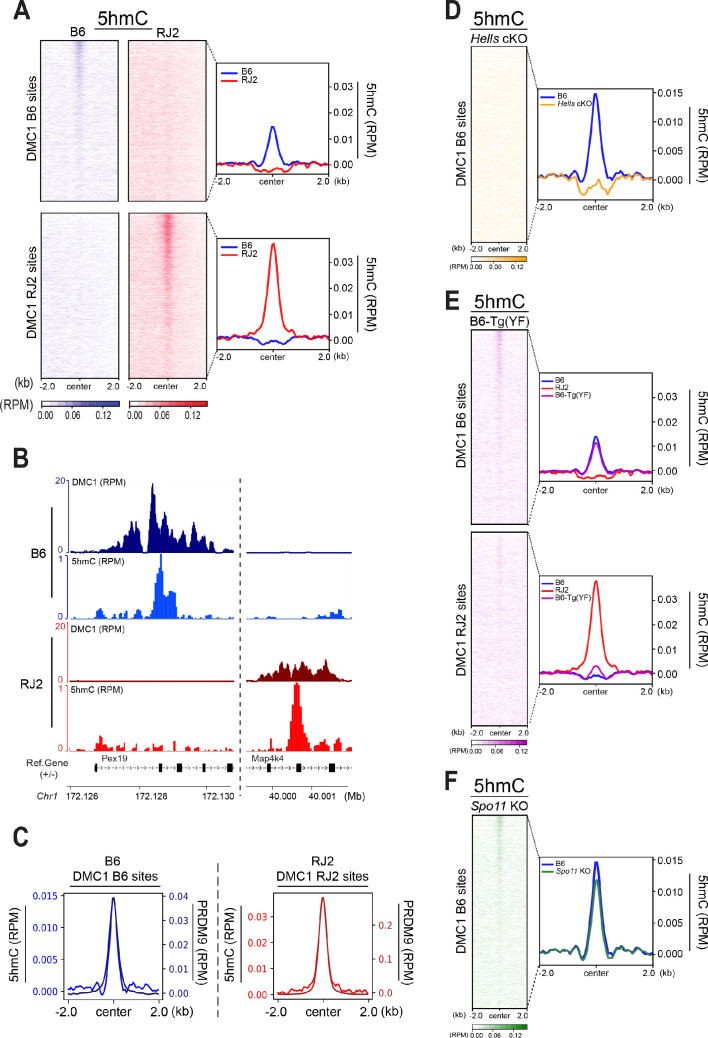
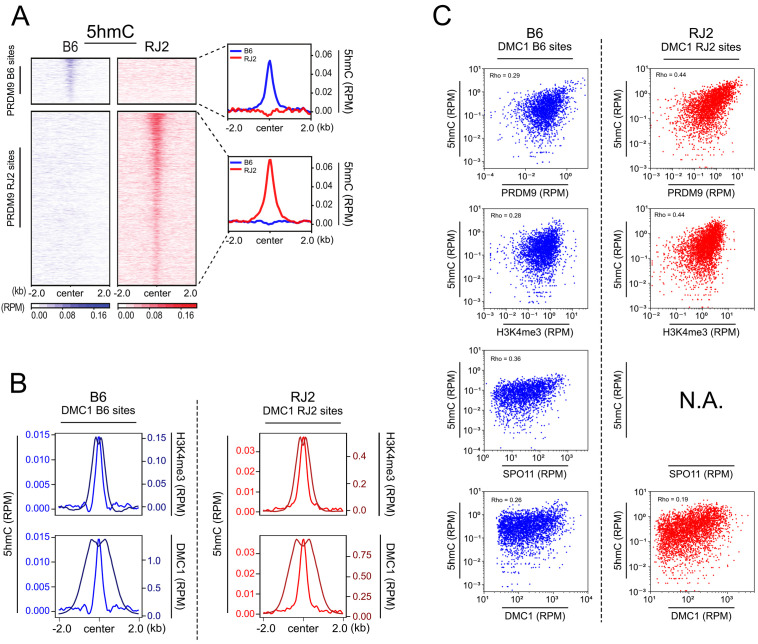
Figure 4. 5hmC is enriched at PRDM9-dependent sites and correlates with PRDM9 occupancy.
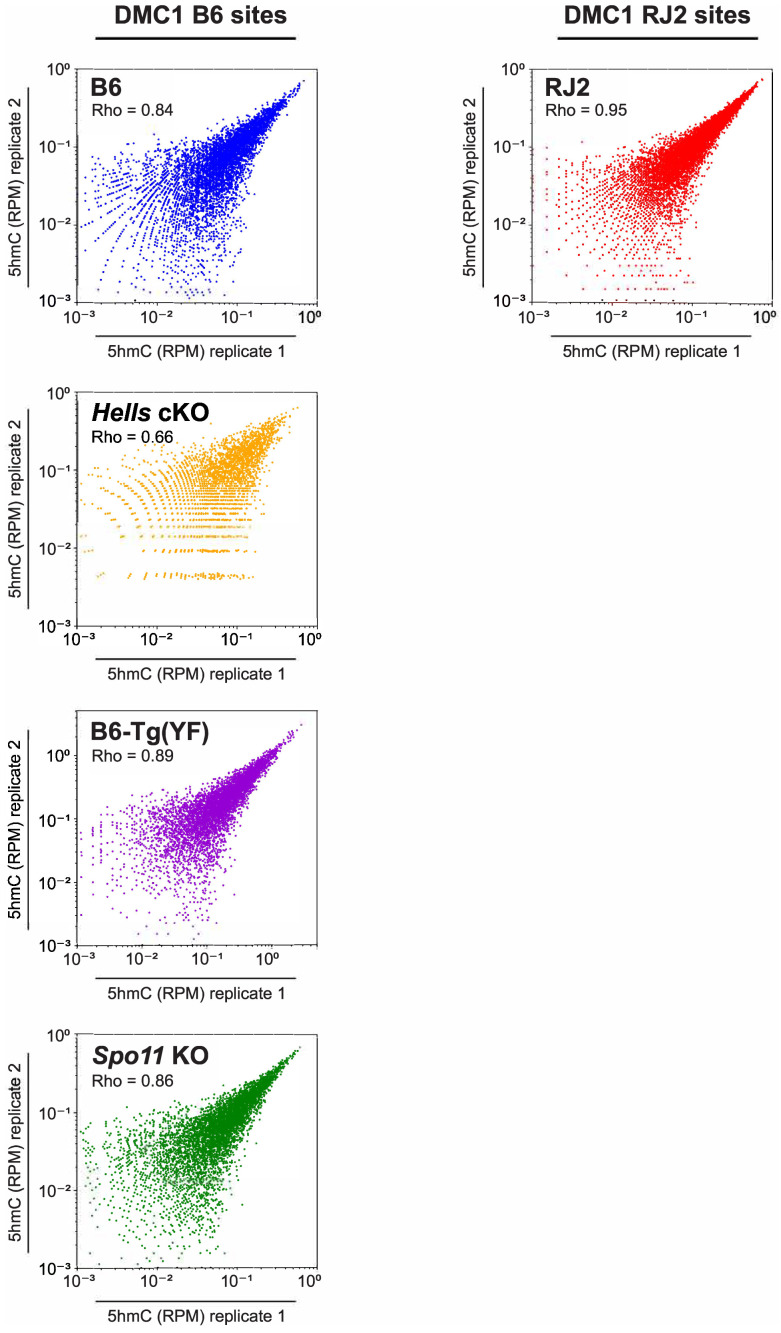
(A) Average read enrichment and heatmaps showing 5hmC enrichment in the B6 (blue) and RJ2 (red) strains. Signal was calculated in a +/- 2 kb window around hotspot centers (determined by DMC1-SSDS). 5hmC enrichment was calculated from pooled replicates within 50bp bins and normalized by reads per million (RPM) and input. The sites on the heatmaps are ranked by decreasing DMC1-SSDS signal intensity from top to bottom. (B) Read distribution from DMC1 and 5hmC ChIP-seq experiments in the B6 (blue) and RJ2 (red) strains at representative DMC1 PRDM9Dom2 (B6) and PRDM9Cst (RJ2) specific sites on chromosome 1. Read distribution was calculated from pooled replicates within 50bp bins and normalized by library size and input, except for the DMC1 ChIP experiments. (C) Average read enrichment showing 5hmC enrichment (left y axis) and PRDM9 read enrichment (right y axis) in the B6 (blue) and RJ2 (red) strains centered in a +/- 2 kb window around DMC1 B6 and DMC1 RJ2 sites, respectively. Read distribution was calculated from pooled replicates within 50bp bins and normalized by library size and input. (D) 5hmC signal at hotspots is HELLS-dependent. Average read enrichment showing 5hmC in the B6 (blue) and Hells cKO (orange) strains centered in a +/- 2 kb window around the hotspot centers (DMC1-SSDS B6 sites). 5hmC enrichment was calculated from pooled replicates within 50bp bins and normalized by read per million (RPM) and input. (E) 5hmC signal at hotspots is dependent on PRDM9 methyltransferase activity. Average read enrichment showing 5hmC in the B6 (blue), RJ2 (red) and B6-Tg(YF)(magenta) strains centered in a +/- 2 kb window around the hotspot centers (DMC1-SSDS B6 and RJ2 sites). 5hmC enrichment was calculated from pooled replicates within 50bp bins and normalized by read per million (RPM) and input. (F) 5hmC signal at hotspots is independent of DSB formation. Average read enrichment showing 5hmC enrichment in the B6 (blue) and Spo11 KO (green) strain centered in a +/- 2 kb window around the hotspot centers (DMC1-SSDS B6 sites). 5hmC enrichment was calculated form pooled replicates within 50bp bins and normalized by read per million (RPM) and input. The duplicate analysis for all genotypes is shown in Figure 4—figure supplement 2.


