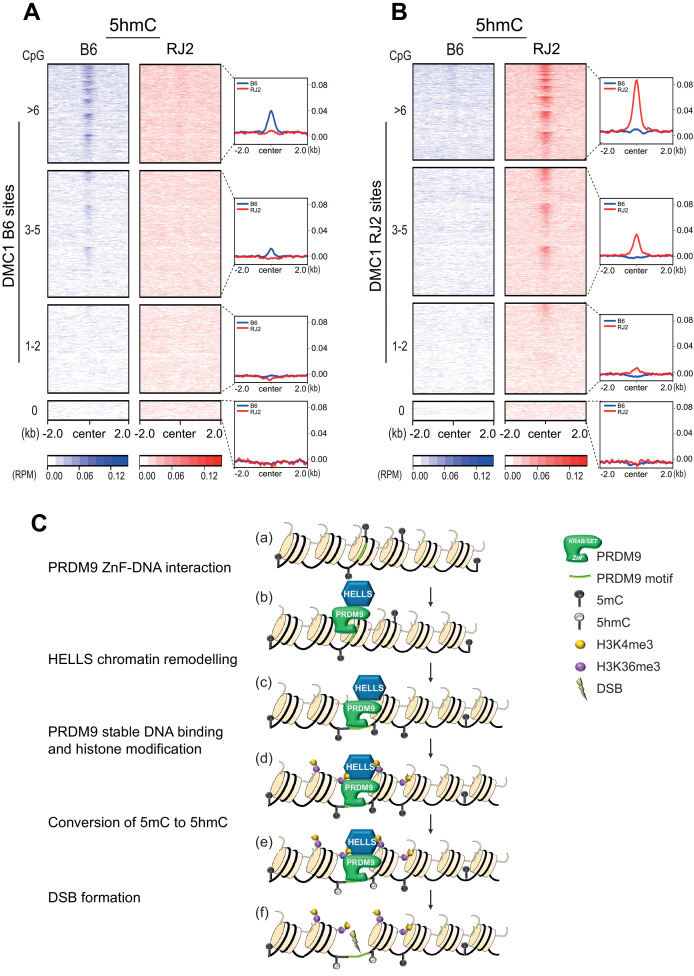
Figure 5. 5hmC enrichment at DSB sites sorted by CpG content and model.
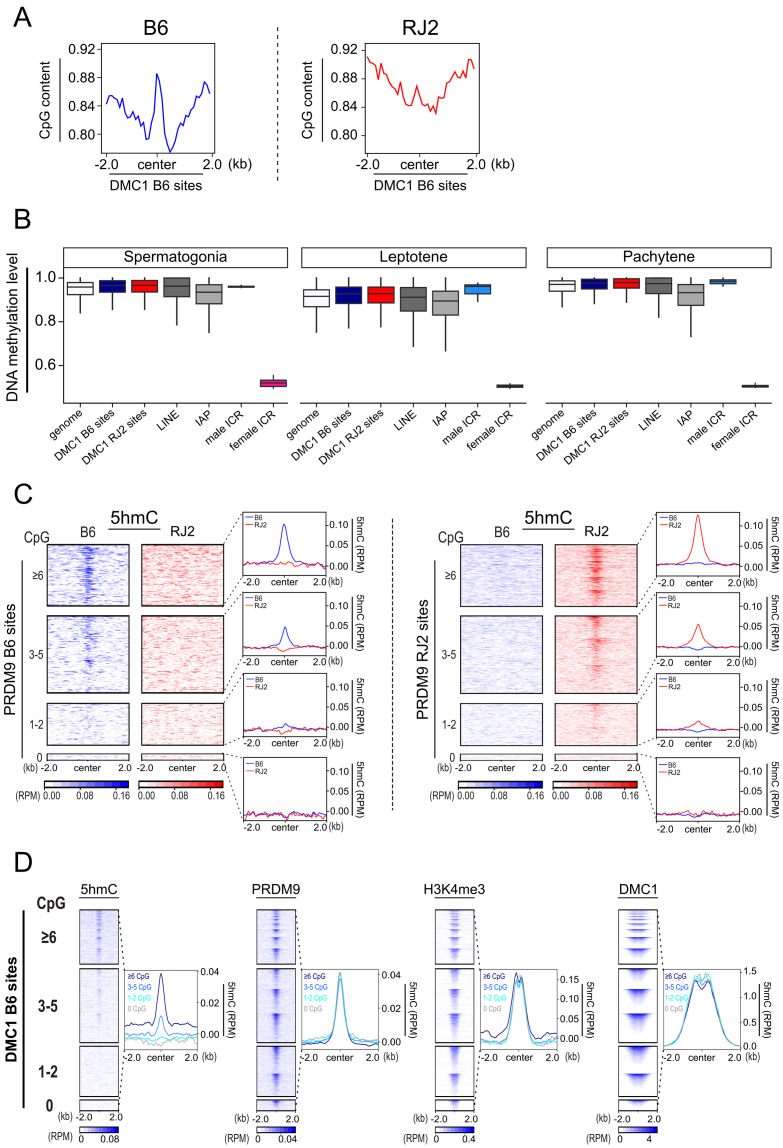
(A) Average read enrichment and heatmaps showing 5hmC enrichment at DMC1-SSDS B6 sites. (B) Average read enrichment and heatmaps showing 5hmC enrichment at DMC1-SSDS RJ2 sites. In both panels, the signal was calculated in the B6 (blue) and RJ2 (red) strain in a +/- 2 kb window around the hotspot centers (determined by DMC1-SSDS) and sorted by CpG content with hotspots clustered in four groups: hotspots without CpGs, and three groups of similar size containing increasing numbers of CpGs (1–2, 3–5, and at least 6 CpGs). The number of sites for each group is indicated in the Methods section. For a given CpG content, the sites are ranked by decreasing DMC1-SSDS signal intensity from top to bottom. CpG content was calculated in a +/- 250 bp window around the hotspot centers. The same analysis but at PRDM9 sites is shown in Figure 5—figure supplement 1C. (C) Model for the targeting of DSB activity by PRDM9/HELLS in mouse male meiosis. (a) A potential PRDM9-binding site is a specific DNA motif in a region of chromatin with no specific feature. For each nucleosome, only two histone tails (H3) are shown. (b) The zinc-finger domain of PRDM9 (ZnF) interacts with specific DNA motifs. PRDM9 may be interacting as a complex with HELLS before binding to its target sites as suggested by Spruce et al., 2020. (c) HELLS promotes chromatin remodeling, enhancing accessibility of PRDM9 to its DNA motif and a stable interaction. (d) PRDM9 methyltransferase catalyzes H3K4me3 and H3K36me3 on adjacent nucleosomes. These histone modifications may or not be symmetric (Lange et al., 2016). H3K9Ac is also known to be enriched near PRDM9 -binding site at this stage (not shown). (e) Putative methylated cytosines (5mC) near the PRDM9-binding site are converted to 5hmC, suggesting the recruitment of a TET enzyme. (f) DSB forms at or adjacent to the PRDM9-binding site.


