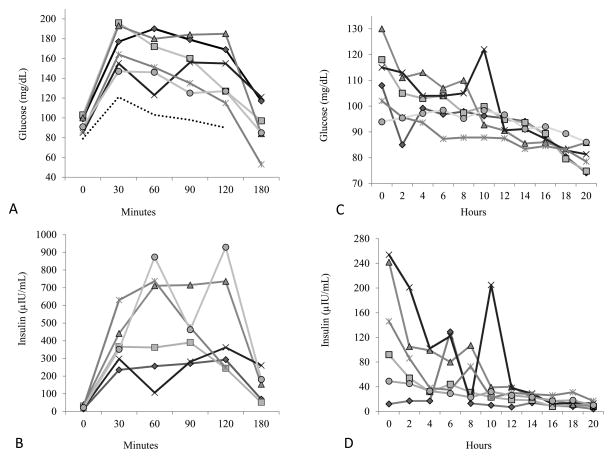
Figure 1.
(A) Individual plasma blood glucose levels during the oral glucose tolerance test in 6 children with SMA type II. The dashed bottom line represents the mean value for healthy children.27 The dotted line at 140 mg/dL represents the cut-off for impaired glucose tolerance at 120 minutes. (B) Individual plasma insulin levels during the oral glucose tolerance test for the same 6 children. (C, D) Individual plasma blood glucose and insulin levels, respectively during the medically supervised 20-hour fast in 6 well children with SMA type II.

