
Figure 1.
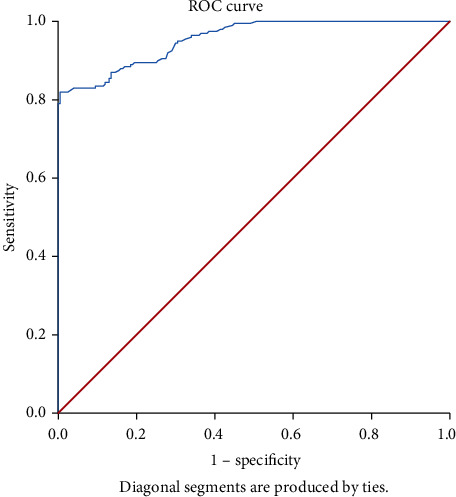
ROC curve for ELISA. ELISA absorbance that maximized the total of sensitivity and specificity was selected as the best cut-off value.
Official websites use .gov
A
.gov website belongs to an official
government organization in the United States.
Secure .gov websites use HTTPS
A lock (
) or https:// means you've safely
connected to the .gov website. Share sensitive
information only on official, secure websites.
ROC curve for ELISA. ELISA absorbance that maximized the total of sensitivity and specificity was selected as the best cut-off value.