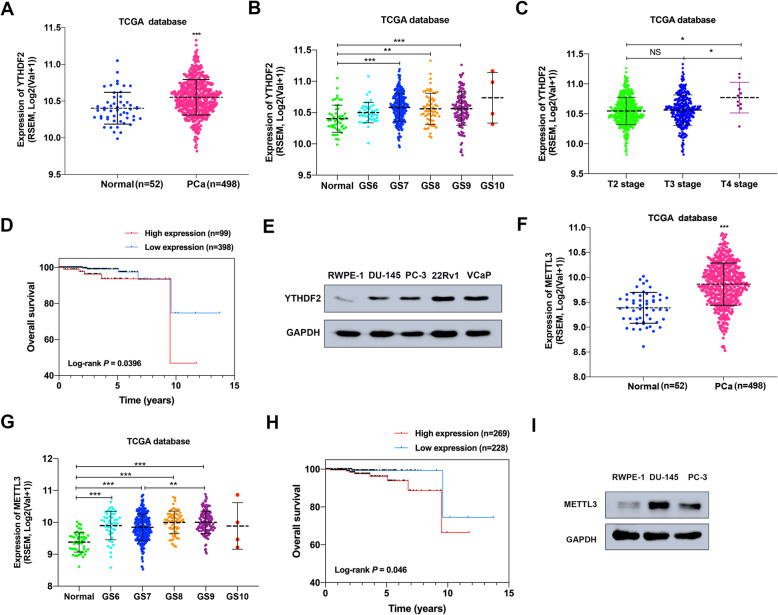
Fig. 1.
YTHDF2 and METTL3 are frequently upregulated in PCa. a-c The expression pattern of YTHDF2 in total, separate Gleason scores or different T stages were analyzed in 498 PCa tissues and 52 normal controls (TCGA database). Student’s t test was used for statistical analysis of two groups. One-way ANOVA test with Bonferroni’s correction was used for statistical analysis of more than two groups comparisons. d Kaplan–Meier curve was used to evaluate the overall survival rate in a cohort of 497 PCa patients according to the relative mRNA expression of YTHDF2. P value (P = 0.0396) was calculated with log-rank test. e The protein level of YTHDF2 in RWPE-1 and PCa cell lines analyzed by the western blot assay. GAPDH was the internal reference. f, g The expression pattern of METTL3 in total or in separate Gleason score in 498 PCa tissues (52 normal controls) were analyzed by TCGA database. Student’s t test was used for the statistical analysis of two groups comparison. One-way ANOVA test with Bonferroni’s correction was used for statistical analysis of more than two groups comparisons. h The survival probability of METTL3 in PCa patients was analyzed with Kaplan–Meier analysis and log-rank test in 497 PCa patients according to the relative expression of METTL3. i The protein level of METTL3 in RWPE-1 and PCa cell lines analyzed by the western blot assay. GAPDH was the internal reference. Error bars represent the SD obtained from at least three independent experiments; *P ≤ 0.05, **P ≤ 0.01, ***P ≤ 0.001

