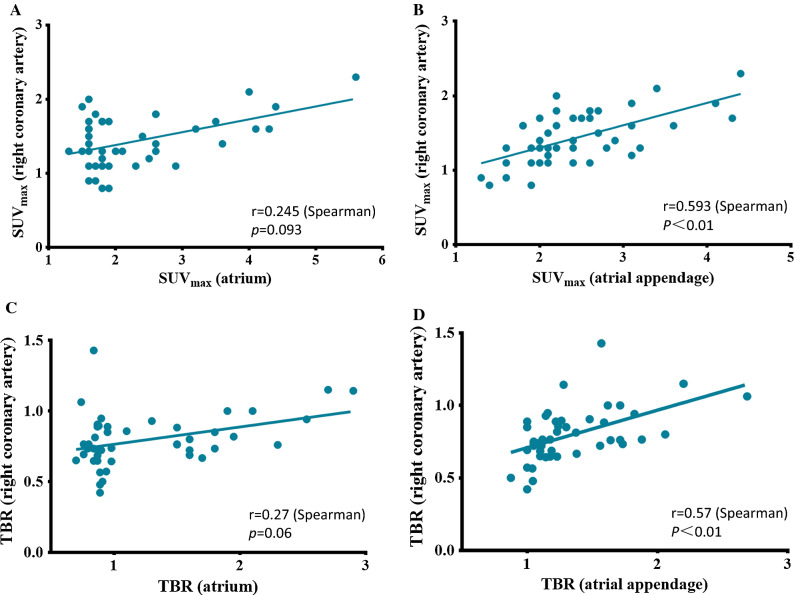
Figure 5.
Linear correlation analysis between the maximum standardized uptake value, (SUVmax) of epicardial adipose tissue (EAT) in right coronary artery and that of atrium (A) and atrial appendage (B). Linear correlation analysis between the TBR of EAT in the right coronary artery and the TBR of atrium (C) and atrial appendage (D)

