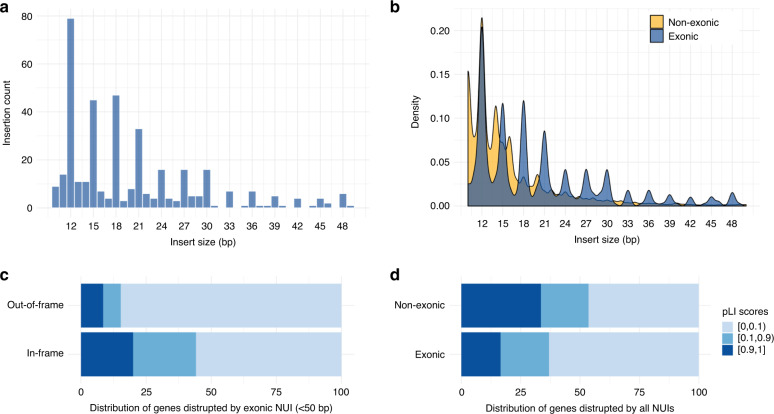
Fig. 2. Evolutionary constraints on exonic NUIs.
a Histogram of small NUIs (<50 bp) disrupting exons. The 3 bp periodic trend shows that the majority of these events are in-frame, suggesting that that a strong evolutionary constraint is in place to preserve the structural and functional integrities of the proteins. b Density plot comparing the 3 bp periodic trend in exonic (blue) versus non-exonic (yellow) NUIs. c Horizontal barplot showing the pLI scores distributions of genes whose exons are disrupted by in-frame or out-of-frame small NUIs. d As in c but exonic and non-exonic NUIs of all size ranges are compared.

