
Fig. 1. Average R2 between low-coverage and high-coverage gene expression estimates (Smart-Seq2 dataset, alpha cells).
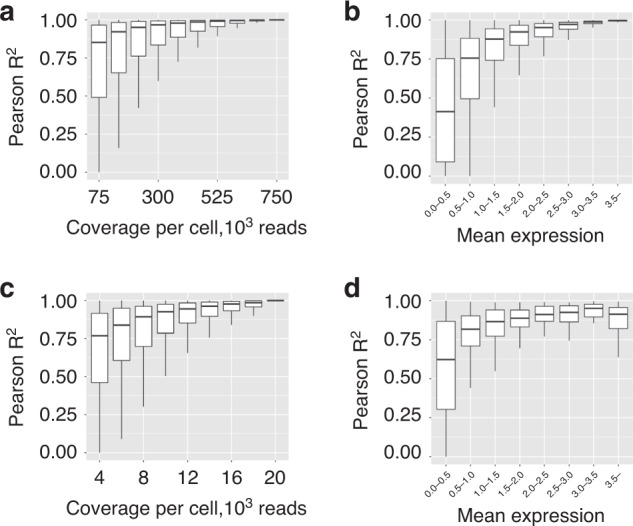
a Distribution of Pearson R2 computed across all the genes at different levels of read coverage, Smart-Seq2 dataset. b Distribution of Pearson R2 at 75,000 reads per cell stratified by the expression level, Smart-Seq2 dataset. c Distribution of Pearson R2 computed across all the genes at different levels of read coverage, 10× dataset. d Distribution of Pearson R2 at 4000 reads per cell stratified by the expression level, 10× dataset. The center line, bounds of box, and whiskers represent mean, 25th to 75th percentile range, and minimum to maximum range in all boxplots.