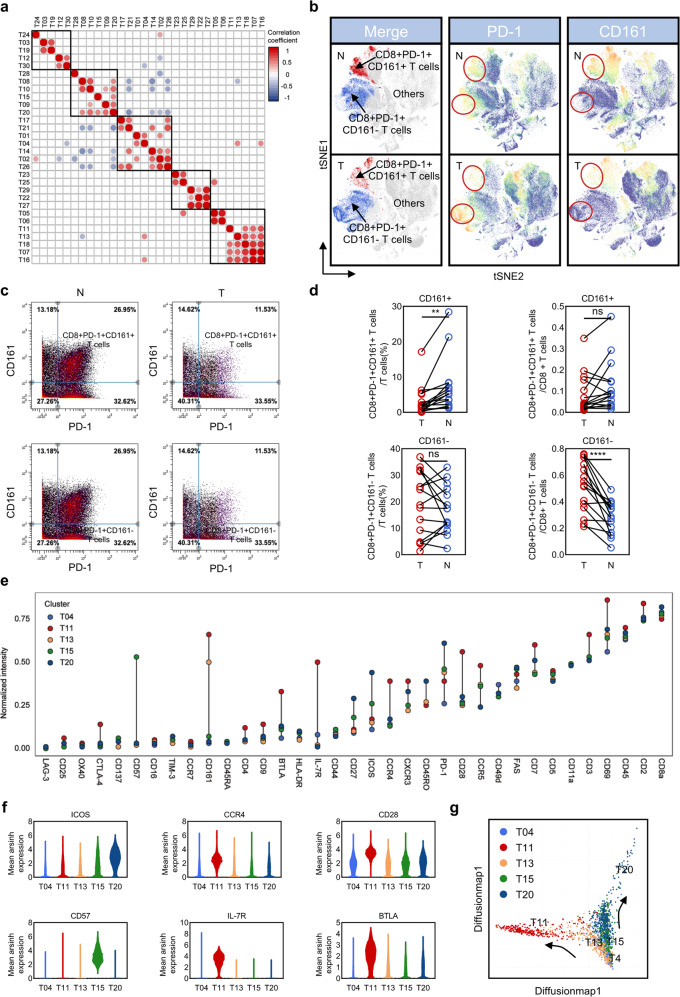
Fig. 2. Changes in the proportion of CD8+PD-1+CD161+/− T cells and phenotype difference.
a T cells correlation matrix. b Characteristic markers tSNE plot (PD-1 and CD161). c, d Reverse changes of CD8+PD-1+CD161+/CD8+PD-1+CD161− T cells in T and N, figure c is pre-gated with CD8. e Thirty-five markers mean expression of CD8+PD-1+CD161+ T cells (T11 and T13) and CD8+PD-1+CD161− T cells (T04, T15, and T20). f Differential expression of ICOS, CCR4, CD28, CD57, IL-7R, and BTLA. g Diffusion map of CD8+PD-1+ T cells.

