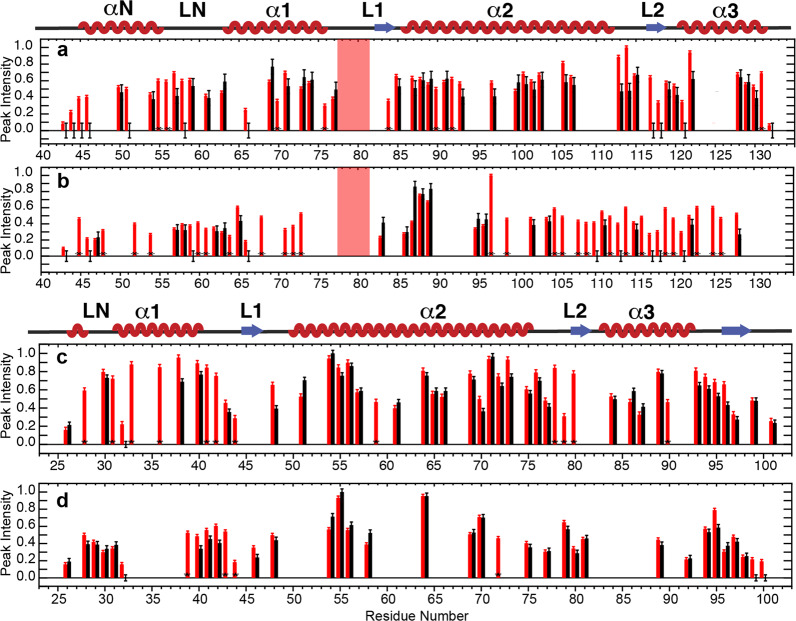
Fig. 5. Several regions in the globular domains of hH3 and hH4 in the telomeric NCP possess relative enhanced microsecond–millisecond dynamics in comparison with the Widom 601 NCP.
a Normalized NCA and, b NCO peak heights of the Widom 601 NCP (red) and the telomeric NCP (black) containing 13C, 15N-labeled hH3. c Normalized NCA and, d NCO peak heights of the Widom 601 NCP (red) and the telomeric NCP (black) containing 13C, 15N-labeled hH4. The peak intensities were normalized to the highest peak intensity in the corresponding dataset. Error bars were derived from the RMSD values of spectral noise. Only residues in the hH3 P43–G132 region and the hH4 I26–G101 region and nonoverlapping in the Widom 601 NCP are shown. Red boxes in both graphs highlight residues F78–D81 of hH3 that are absent in both of the spectra of Widom 601 and telomeric NCP. Peaks that are absent in telomeric NCP are shown with zero intensity with error bars. Asterisks marks peaks that are resolved in Widom 601 NCP, but not in telomeric NCP (due to small chemical shift perturbations and peak broadening). The residues that have peak intensity differences exceeding error bars are considered as having different dynamical properties.

