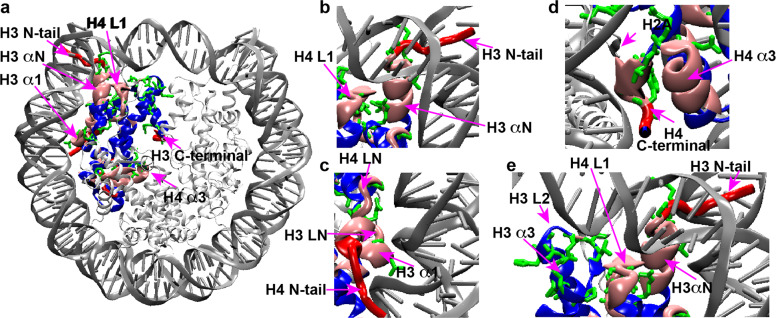
Fig. 6. hH3 and hH4 residues exhibiting enhanced microsecond–millisecond dynamics in the telomeric NCP compared with the Widom 601 NCP are primarily reside at the identified dynamic networks and a neighboring region.
a H3 and H4 residues exhibiting lower relative NCA and NCO intensities that correspond to enhanced microsecond–millisecond dynamics in the telomeric NCP, as compared with the Widom 601 are shown in a chemical bond representation (green) in the NCP structure. The dynamic networks formed by H3 and H4 flexible regions are mapped onto the structure as shown in Fig. 4. b–e A zoomed-in view of the corresponding regions. Only one copy of each histone are displayed in b–e.

