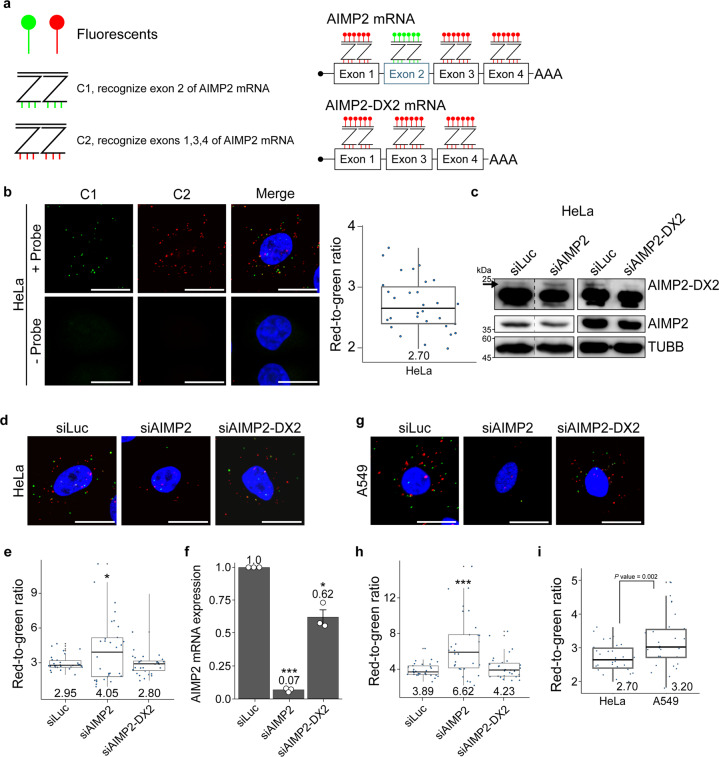
Fig. 1. RNA-smFISH to quantify the expression ratio of AIMP2-DX2/AIMP2.
a The design of RNA-smFISH probes. C1-tagged ZZ pairs target the exon 2 of AIMP2, and C2-tagged ZZ pairs target exons 1, 3, and 4 of AIMP2 and AIMP2-DX2. By using two different fluorophores for visualization, both probes can be hybridized and analyzed simultaneously. b C1 and C2 probes of the RNA-smFISH yield foci-like signal patterns in HeLa cells. Without the hybridization of probes, no fluorescent signal was detected. Bars indicate 20 μm. Box plot of the quantified red-to-green signal is shown on the right with the average ratio indicated in the bottom. Thirty images were analyzed. c Transfecting siRNAs specific to the full-length AIMP2 or AIMP2-DX2 effectively reduced target protein expressions in HeLa cells. The black arrow indicates the true-positive band for AIMP2-DX2. TUBB was used as loading control. d RNA-smFISH images upon transfecting HeLa cells with siAIMP2 or siAIMP2-DX2. Bars indicate 20 μm. e Box plot of RNA-smFISH red-to-green signal ratios in siRNA-transfected cells. Numbers on the box plots specify the average ratio of 30 images. f The knockdown efficiency of siRNAs was confirmed using RT-qPCR. The average of three replicates is shown with error bars indicating s.e.m. Numbers on the bar specify the average values. RNA expressions were measured relative to the control GAPDH. g RNA-smFISH images of siRNA-transfected A549 cells. Bars indicate 20 μm. h Box plot of red-to-green signal ratios in A549 cells. Numbers on the box plots specify the average ratio of 30 images. i A comparison of the red-to-green signal ratio between HeLa and A549. Numbers on the bottom indicate average ratios of 30 images. The data for HeLa is the same as the one shown in b. Box plot features: center line, median; box limits, upper and lower quartiles; whiskers, 1.5× interquartile range; points, individual red-to-green ratio. *P < 0.05, ***P < 0.001. For statistical analysis, a one-tailed t test with unequal variance was used. smFISH single-molecule fluorescence ISH.

