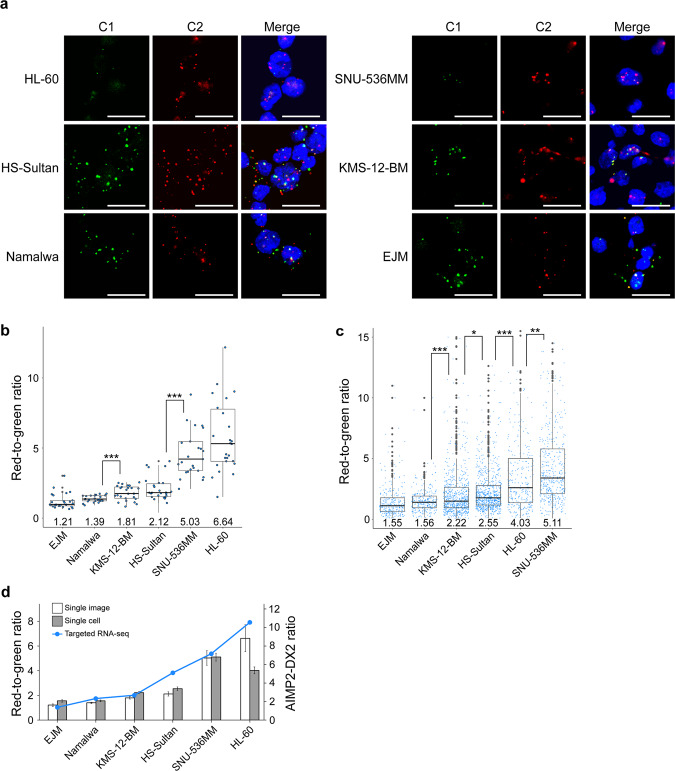
Fig. 4. RNA-smFISH to subclassify hematologic cancer cells.
a RNA-smFISH images of six hematologic cancer cell lines. Bars indicate 20 μm. b Box plot of the quantified red-to-green signal ratio of six hematologic cancer cell lines. One ratio was calculated per image. Numbers on the box plots specify the average ratios. n = 25 for EJM, Namalwa, KMS-12-BM, and SNU-536MM. n = 26 for HS-Sultan and HL-60. c Box plot of RNA-smFISH single-cell analysis of six hematologic cancer cell lines. Numbers on the box plots specify the average ratios. n = 287 for EJM, n = 273 for Namalwa, n = 665 for KMS-12-BM, n = 737 for HS-Sultan, n = 299 for HL-60, and n = 468 for SNU-536MM cells. d Comparison of red-to-green ratios of smFISH image quantitation for single-image (white bar) and single-cell (gray bar) analysis, and AIMP2-DX2 ratio of targeted RNA-sequencing (blue line). Bar graphs and the point plot indicate the mean of the corresponding method. Box plot features: center line, median; box limits, upper and lower quartiles; whiskers, 1.5× interquartile range; points, individual red-to-green ratio. *P < 0.05, **P < 0.01, ***P < 0.001. For statistical analysis, a one-tailed t test with unequal variance was used. smFISH single-molecule fluorescence ISH.

