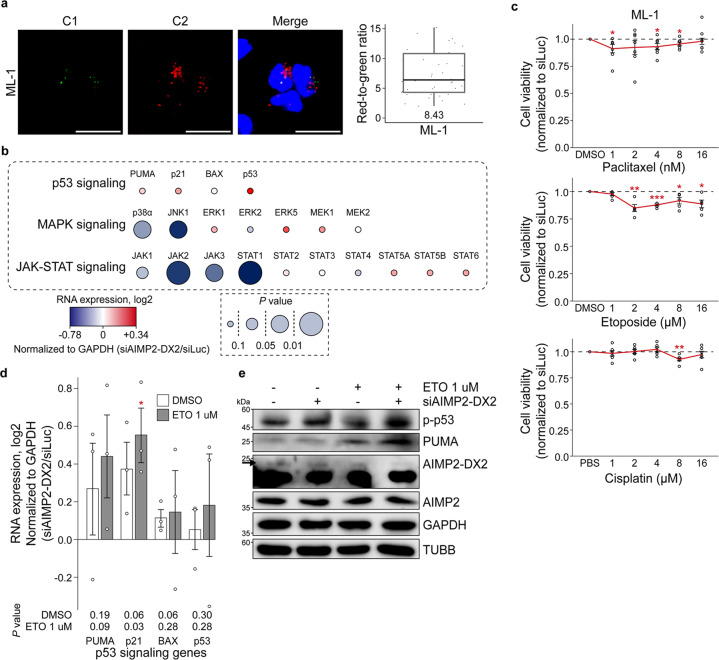
Fig. 6. Analysis of AIMP2-DX2 in AML.
a RNA-smFISH images of ML-1 cells. Bars indicate 20 μm. Box plot of the quantified red-to-green signal is shown on the right with the number in the bottom denotes the average ratio of 51 images. b AIMP2-DX2 is positively correlated with MAPK and JAK-STAT signaling pathways in ML-1 cells. The RNA expression profiles of representative genes for p53, MAPK, and JAK-STAT signaling pathways are visualized. GAPDH normalized fold change and its P values are indicated as color and size of the corresponding circle, respectively. n = 6 for p53 signaling pathway genes, and n = 7 for other signaling pathway genes. c Electroporation with siAIMP2-DX2 enhances apoptosis induced by paclitaxel, etoposide, and cisplatin in ML-1 cells. n = 7 for paclitaxel, n = 5 for etoposide, n = 6 for cisplatin. A solid red line indicates cell viability relative to siLuc, while a black dashed line indicates cell viability of control. For all data presented, the average is shown with error bars indicate s.e.m. d, e Knockdown of AIMP2-DX2 can activate the p53 signaling pathway upon etoposide treatment. In d, the RNA expression of the representative genes for the p53 signaling pathway is examined. For all data presented, an average of three biological replicates is shown with error bars indicate s.e.m. The numbers under the graph denote the P values. In e, protein expression of phosphorylated p53 and PUMA are examined via western blotting. The black arrow indicates the band for the AIMP2-DX2 protein. GAPDH and TUBB were used as loading control. Box plot features: center line, median; box limits, upper and lower quartiles; whiskers, 1.5× interquartile range; points, individual red-to-green ratio. *P<0.05, **P<0.01. For statistical analysis, a one-tailed t test with unequal variance was used. AML acute myeloid leukemia, smFISH single-molecule fluorescence ISH, ETO etoposide.

