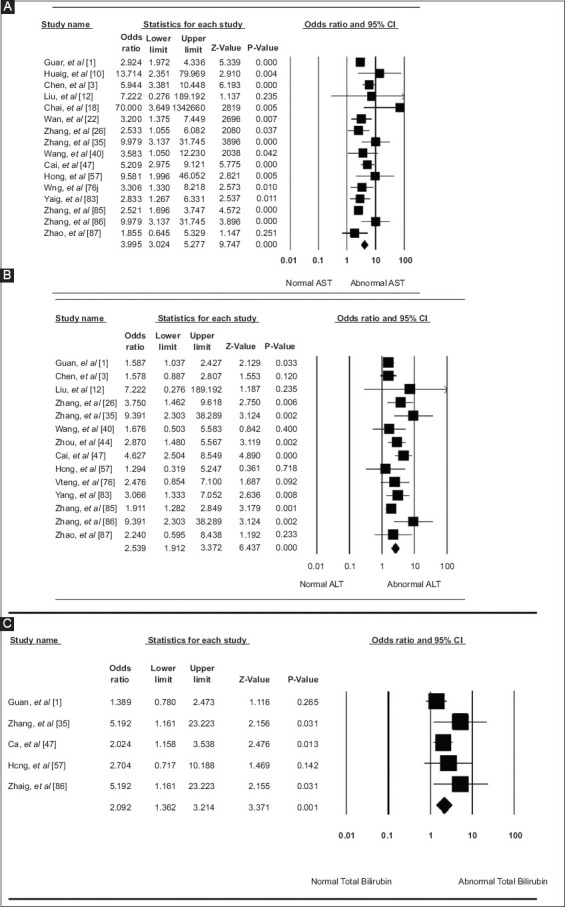
Figure 3.

Forest plot demonstrating (A) severe disease in elevated AST vs, normal AST, (B) severe disease in elevated ALT vs. normal ALT, and (C) severe disease in elevated TB vs. normal TB
AST, aspartate aminotransferase; ALT, alanine aminotransferase; TB, total bilirubin
