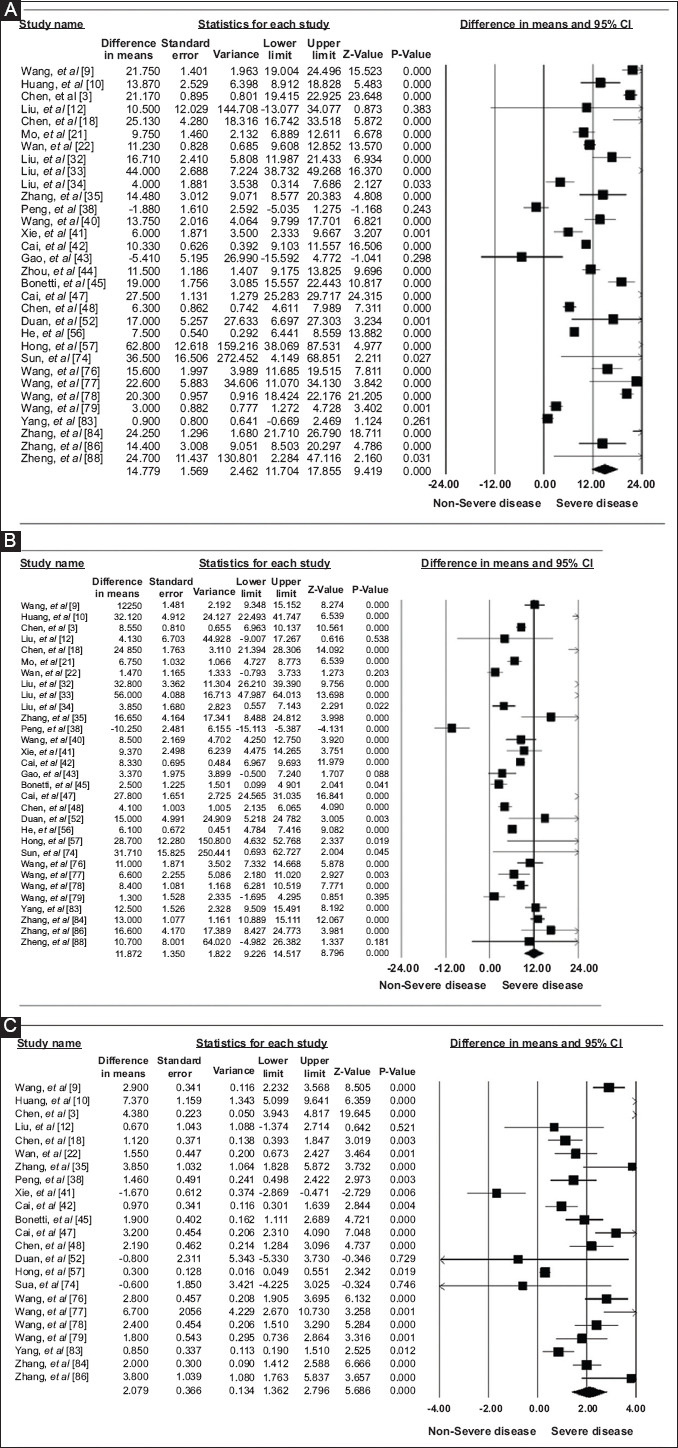
Figure 4.

Forest plot demonstrating (A) mean serum AST in severe vs. non-severe disease, (B) mean serum ALT in severe vs. non-severe disease, and (C) mean serum TB in severe vs. non-severe disease
AST, aspartate aminotransferase; ALT, alanine aminotransferase; TB, total bilirubin
