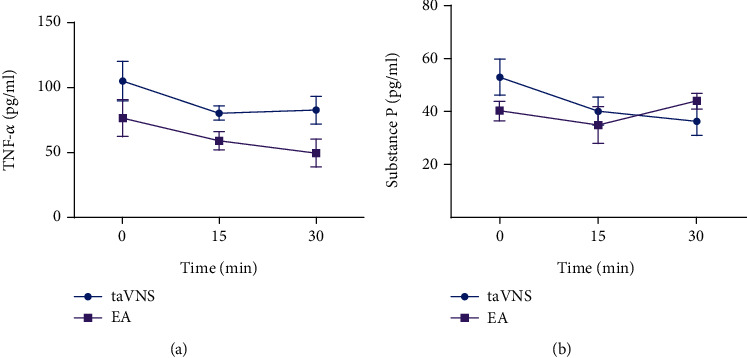
Figure 2.

Comparison of plasma concentration of TNF-α and SP in taVNS and EA groups before, during, and after intervention. (a) Comparison of plasma concentration of TNF-α in taVNS and EA groups before, during, and after intervention. (b) Comparison of plasma concentration of SP in the taVNS and EA groups before, during, and after intervention.
