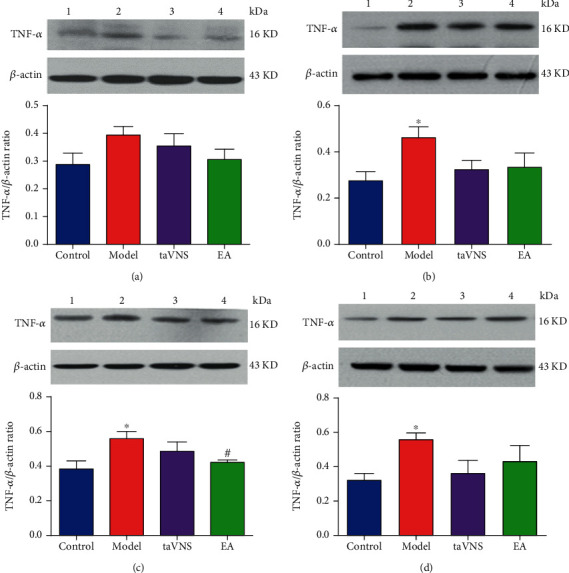
Figure 3.

Expressions of TNF-α in PFC, hippocampus, amygdala, and hypothalamus. (a) Comparison of the TNF-α expression in the PFC for each group at 28 day. (b) Comparison of the TNF-α expression in the hippocampus for each group at 28 day. (c) Comparison of the TNF-α expression in the amygdala for each group at 28 day. (d) Comparison of TNF-α expression in the hypothalamus for each group at 28 day. 1: control group; 2: model group; 3: taVNS group; 4: EA group. ∗P < 0.05, vs. the control group. #P < 0.05, vs. the model group.
