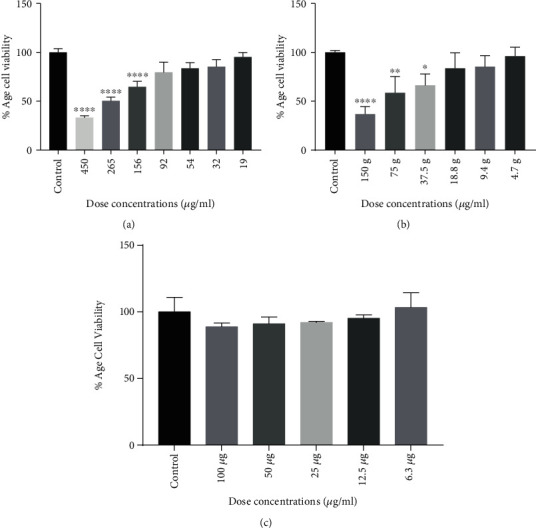
Figure 4.

Cytotoxic effect of lectin (a), lectin protein-loaded chitosan-TPP nanoparticles (b), and chitosan-TPP nanoparticles (c) on HepG2 cells. Bars indicate standard deviation. ∗, ∗∗, ∗∗∗, and ∗∗∗∗ indicate the significance level at p < 0.5, p < 0.01, p < 0.001, and p < 0.0001.
