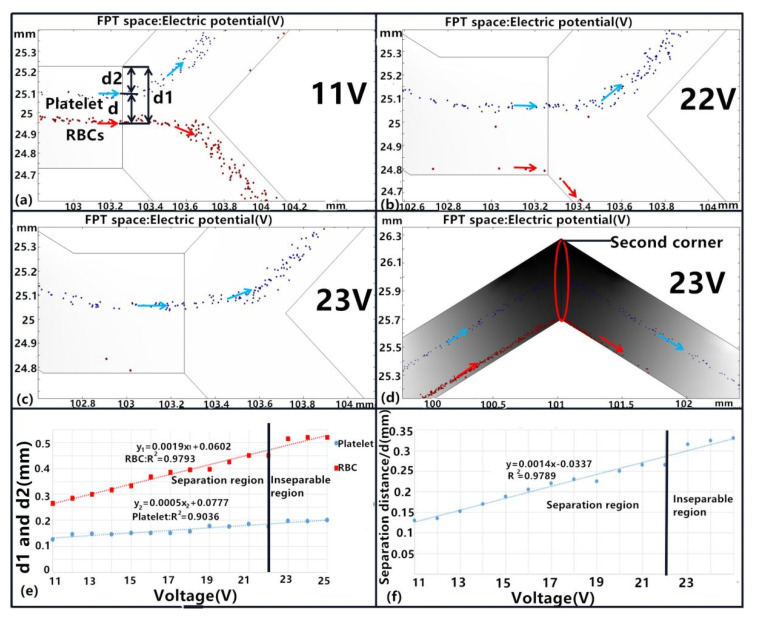
Figure 8.
Effects of the driving voltage on platelet separation. (a–d) Separation under different driving voltages of 11, 22, and 23 V, Blue color arrows mean the flow trajectory of the platelet and red color arrows mean the RBC flow trajectory. (e) Comparison of platelet and RBC separation distances with different driving voltages. (f) The relationship between separation distance and driving voltages. All experiments were conducted with an n = 5, and values are shown as mean ± SD.

