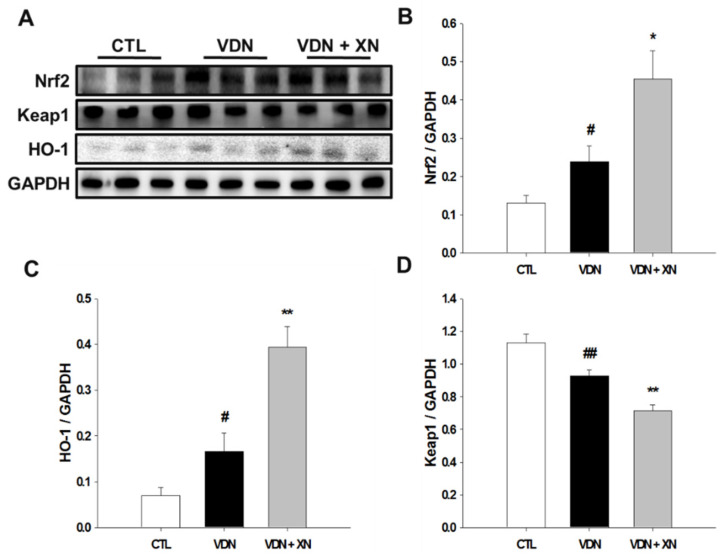
Figure 8.
(A) Effects of XN treatment on protein levels of (B) Nrf2, (C) HO-1, and (D) Keap1 through western blot analysis. GAPDH was a control for protein loading. Results were obtained from six independent experiments, and densitometric analysis of autoradiograms is shown as ratio to GAPDH. Each point represents the mean ± SEM, n = 10. # p < 0.05, ## p < 0.01 compared with the control group. * p < 0.05, ** p < 0.01 compared with VDN group.

