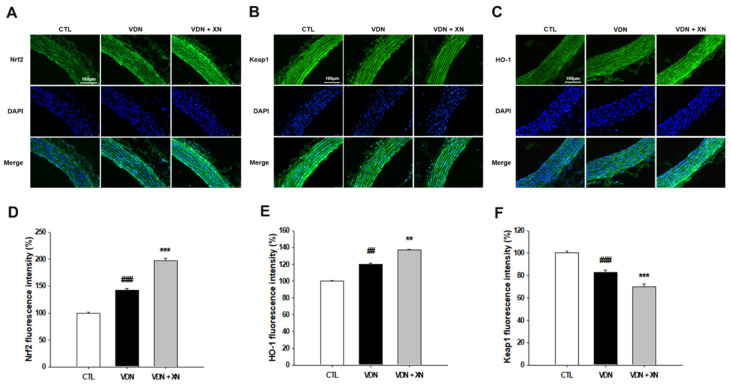
Figure 9.
Effects of XN on the expressions of Nrf2, HO-1, and Keap1 through confocal microscopic evaluation of nuclear thoracic aorta wall. (A) Nrf2, (B) HO-1, (C) Keap1, (D) quantified Nrf2 fluorescence intensity, (E) quantified HO-1 fluorescence intensity, and (F) quantified Keap1 fluorescence intensity, relative to number of nuclei. Counterstaining of nuclei with DAPI in blue was merged into all images. Each point represents the mean ± SEM, n = 6. ## p < 0.01, ### p < 0.001 compared with the control group. ** p < 0.01, *** p < 0.001 compared with VDN group.

