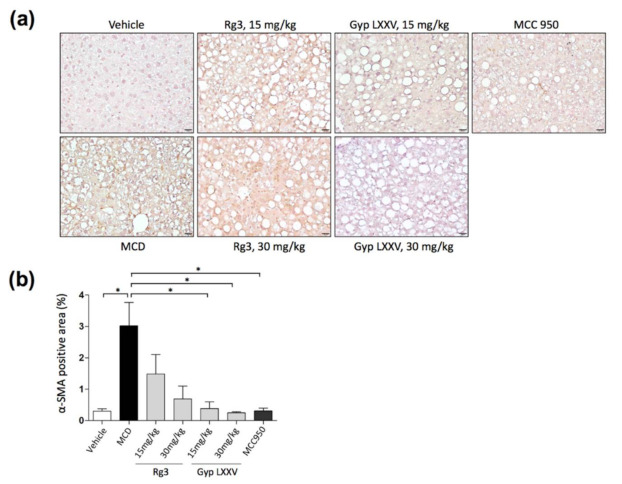
Figure 6.
Immunohistochemical staining of α-SMA in liver samples (a). The distribution of hepatic fibrosis in the MCD diet mouse model with or without Gyp LXXV or Rg3 was investigated. 400× magnification, scale bar 20 μm. Quantification of immunohistochemistry (IHC) for α-SMA was performed using Fiji software (b). Error bars represent SEM. * p < 0.05 vs. MCD, two tailed unpaired t-test.

