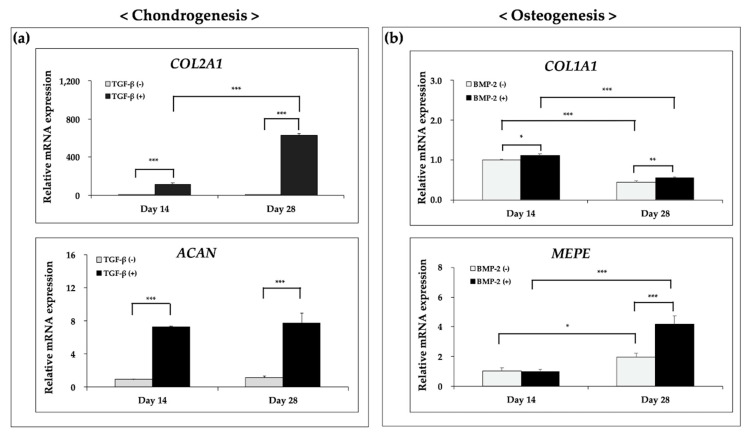
Figure 8.
Expression of cartilage- and bone-specific genes. (a) Relative expression levels of COL2A1 and ACAN; two-way ANOVA with Sidak’s multiple comparison test. (b) Relative expression levels of COL1A1 and MEPE; two-way ANOVA with Tukey’s multiple comparison test. * p < 0.05, ** p < 0.01, and *** p < 0.001.

